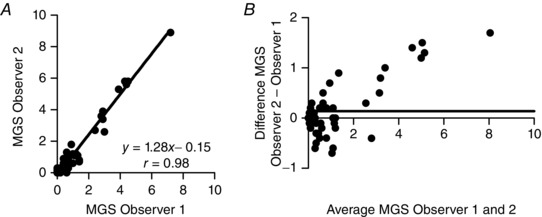
Figure 1. Interobserver comparison for pain assessment using the Mouse Grimace Scale (MGS) at 24 h postsurgery (n = 60 mice before administration of a second dose of buprenorphine) .

A shows very good correlation between observers (Deming's regression). However, Bland–Altman analysis (B) indicates systematic bias, for one observer versus the other, particularly at the upper range of MGS scores. Continuous horizontal line represents the mean difference (n = 60).
