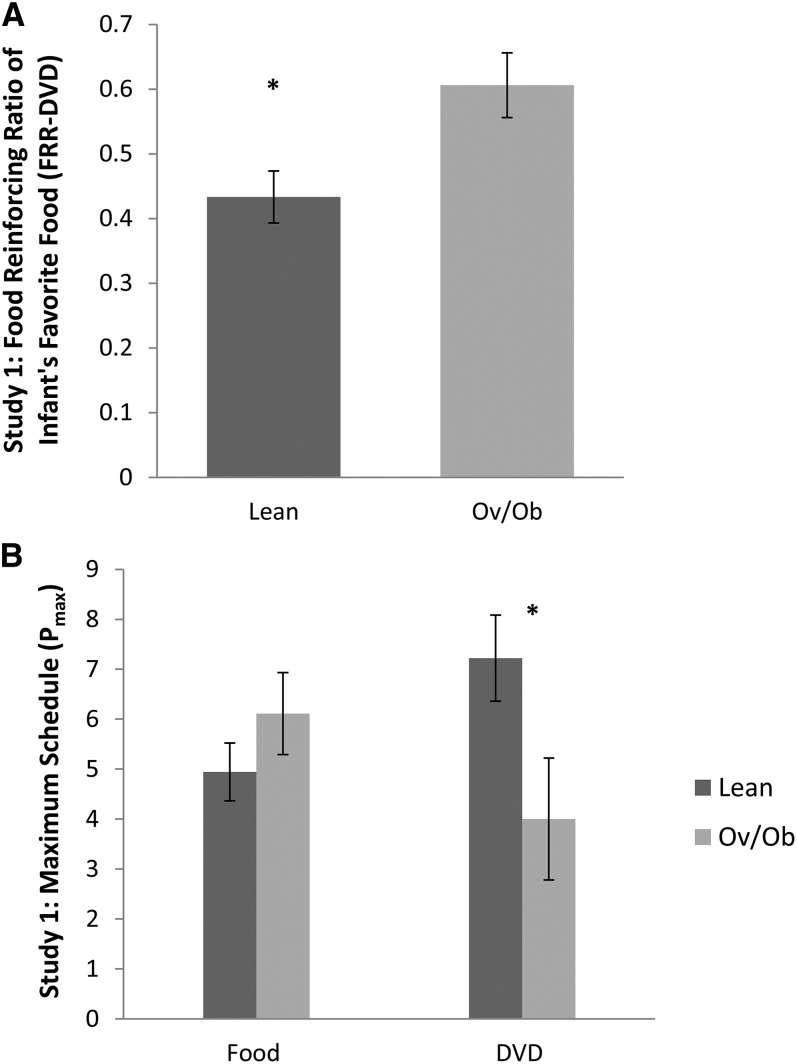
FIGURE 1.
Infant obesity status in relation to food/nonfood reinforcement in study 1. Infants aged 9–18 mo (n = 27) performed the developmentally appropriate food/nonfood reinforcement task. There were 18 lean and 9 Ov/Ob infants. Reinforcing values of food and nonfood alternatives (DVD) were determined by using the maximum schedule achieved for Food Pmax and DVD Pmax. FRR-DVD was determined by calculating the proportion of food responses among all responses [Food Pmax ÷ (Food Pmax + DVD Pmax)]. The linear regression model shows that Ov/Ob infants had significantly higher FRR-DVD (mean ± SEM; lean: 0.43 ± 0.04; Ov/Ob: 0.61 ± 0.05; P = 0.009) (A). There was no difference between lean and Ov/Ob infants in Food Pmax (mean ± SEM; lean: 4.94 ± 0.58; Ov/Ob: 6.11 ± 0.82; P = 0.25) but a greater difference in DVD Pmax (lean: 7.22 ± 0.86; Ov/Ob: 4.00 ± 1.22; P = 0.04) (B). DVD, Baby Einstein–Baby MacDonald shows (Kids II Inc.); DVD Pmax, reinforcing value of nonfood alternative; Food Pmax, reinforcing value of food; FRR-DVD, food reinforcing ratio of favorite food in study 1; Ov/Ob, overweight and obese; Pmax, reinforcing value.

