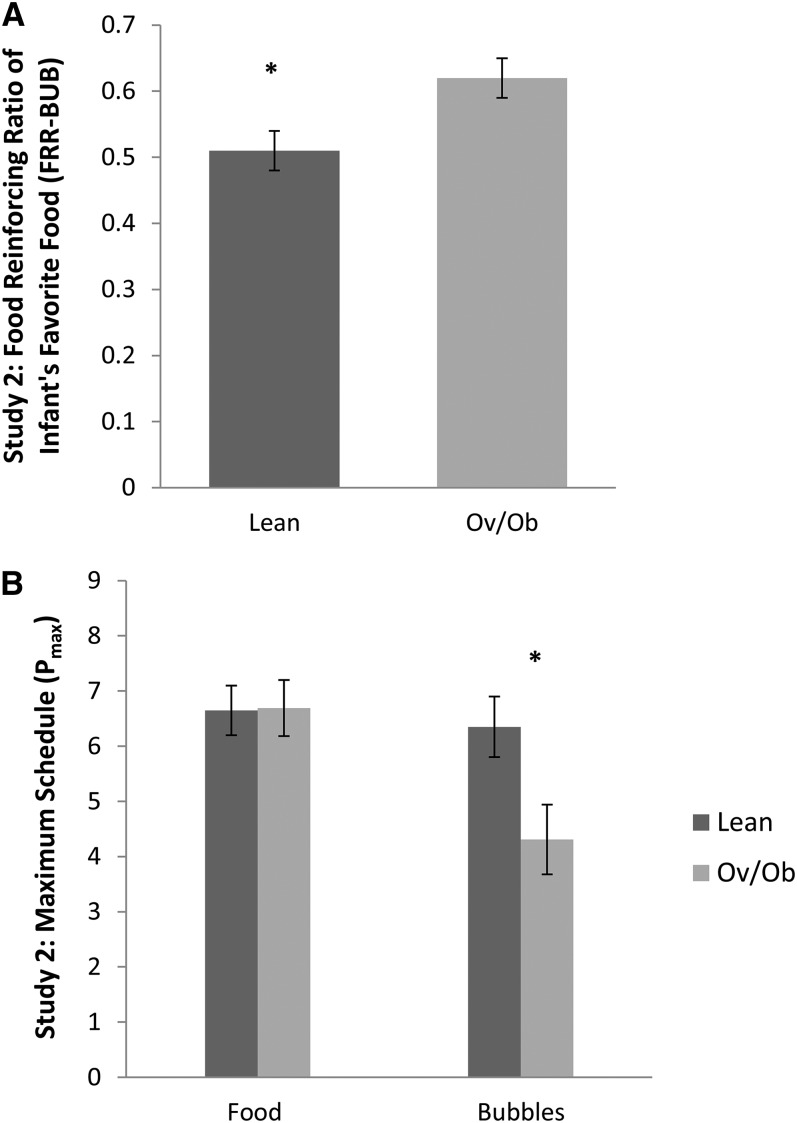
FIGURE 2.
Infant obesity status in relation to food/nonfood reinforcement in study 2. Infants aged 9–18 mo (n = 30) performed the developmentally appropriate food/nonfood reinforcement task. There were 17 lean and 13 Ov/Ob infants. Reinforcing values of food and nonfood alternatives (bubbles) were determined by using the maximum schedule achieved for Food Pmax and BUB Pmax. FRR-BUB was determined by calculating the proportion of food responses among all responses [Food Pmax ÷ (Food Pmax + BUB Pmax)]. The linear regression model shows that Ov/Ob infants had significantly higher FRR-BUB (mean ± SEM; lean: 0.51 ± 0.03; Ov/Ob: 0.62 ± 0.03; P = 0.01) (A). There was no difference between lean and Ov/Ob infants in Food Pmax (mean ± SEM; lean: 6.65 ± 0.45; Ov/Ob: 6.69 ± 0.51; P = 0.95) but a greater difference in BUB Pmax (lean: 6.35 ± 0.55; Ov/Ob: 4.31 ± 0.63; P = 0.02) (B). BUB Pmax, reinforcing value of nonfood alternative (bubbles); Food Pmax, reinforcing value of food; FRR-BUB, food reinforcing ratio of favorite food in study 2; Ov/Ob, overweight and obese; Pmax, reinforcing value.

