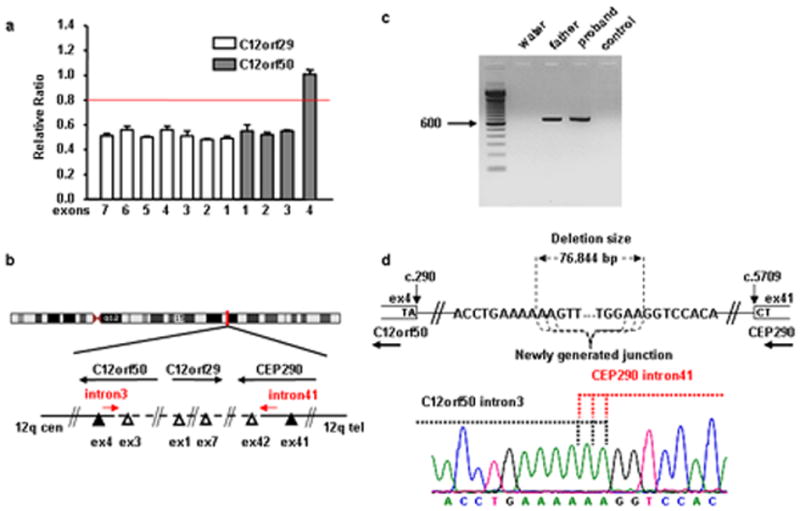
Fig. 2.

Characterization of the deletion breakpoints in COR001 family. a: Dosage analysis of CEP290 neighbouring genes showing the heterozygous deletion of all C12orf29 exons and of C12orf50 exons 1 to 3. b: schematic representation of the genomic region enclosing CEP290, C12orf29 and C12orf50 genes: open and solid triangles represent exons with ratio < 0.6 and between 0.8 and 1.2, respectively. c: agarose gel electrophoresis showing the ~700 bp fragment obtained with genomic primers located adjacent to the supposed deletion breakpoints. d: top schematic representation of the breakpoints. Bottom electropherogram of the fragment across the breakpoints, showing the newly generated junction between C12orf50 intron 3 and CEP290 intron 41 sequences. [Color figure can be viewed in the online issue, which is available at www.interscience.wiley.com]
