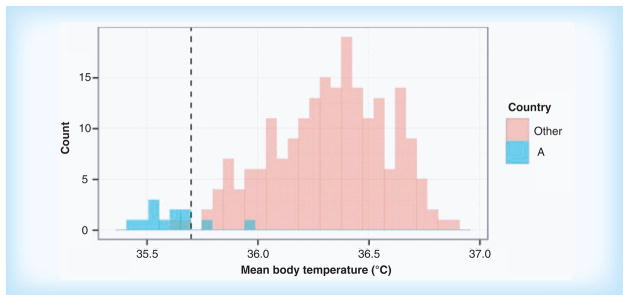
Figure 2. Distribution of mean body temperatures (in °C) for centers in country A and for all other centers in a randomized clinical trial.

The data from 10 of the 12 centers in country A differ statistically form the data in all other centers. The difference was found to be due to a single lot of miscalibrated thermometers. Adapted with permission form [81] © John Wiley and Sons (2014).
