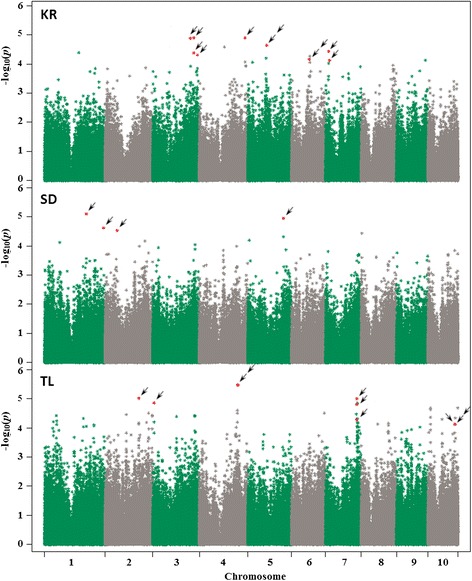
Figure 1.

GWAS results for the three resistance traits to MCB attack in a maize association panel. Each graph (TL, SD, and KR) represent the P-values of the 246,477 SNPs tested for each resistance trait. Each row indicates the SNP significantly associated (RMIP ≥ 0.30) to each resistance trait analyzed.
