Figure 5.

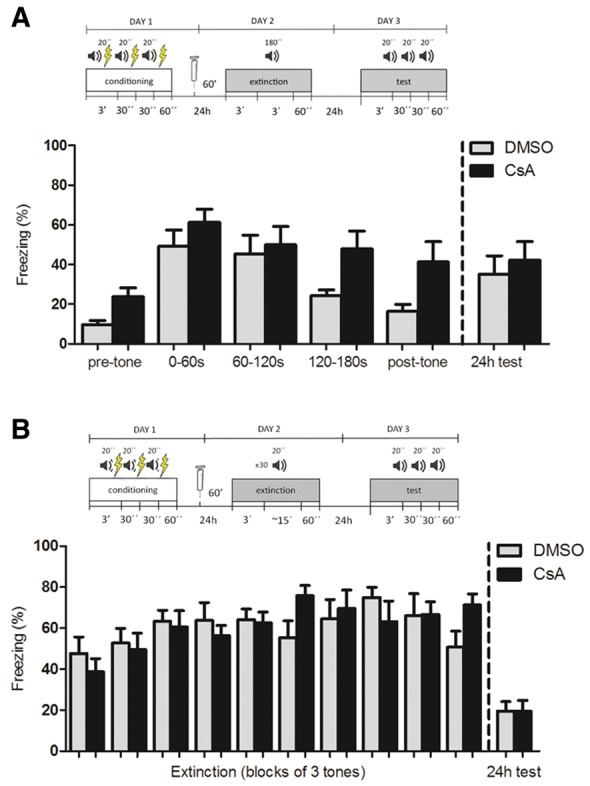
CsA impairs within-session but not between-session extinction of auditory fear conditioning. (A) Schematic representation of the protocol and mean time spent freezing (%) (±SEM) of mice treated with CsA (20 mg/kg) or vehicle (DMSO) 60 min before an extinction session consisting of a single 3-min tone. Bars on the right of the left line show freezing during the 3-min pretone period, the early (0–60 sec), medium (60–120 sec) and late (120–180 sec) periods of the tone, and 1-min period after the tone, showing increased freezing of the CsA-treated animals compared with controls toward the end of the session (n = 8/group, two-way repeated-measures ANOVA, P (drug) = 0.02, P (time) = 0.004, P (interaction) = 0.47). Bars on the right of the dashed line show mean freezing time for the three 20-sec tones in the test session 24 h later, with both groups showing a similarly small, albeit significant, decrease in freezing between the first minute of the extinction session and the test session average (n = 10/group, two-way repeated-measures ANOVA, P (drug) = 0.42, P (time) < 0.0001, P (interaction) = 0.40; Student's t test for group comparison in the test session, P = 0.61). (B) Schematic representation of the protocol and mean time spent freezing (%) (±SEM) of mice treated with CsA (20 mg/kg) or vehicle (DMSO) 60 min before an extinction session consisting of thirty 20-sec tone presentations, with a variable interval of 5–20 sec. Bars on the left side of the dashed line show freezing during the 30 tones, grouped in 3-tone blocks, with no difference in freezing between CsA-treated and control animals and absence of extinction during this session for both groups (n = 10/group, two-way repeated-measures ANOVA, P (drug) = 0.88, P (time) = 0.0002, P (interaction) = 0.05). Bars on the right of the dashed line show mean freezing time for the three 20-sec tones in the test session 24 h later, indicating significant between-session extinction in both groups, with no difference between them in the test session (n = 10/group, two-way repeated-measures ANOVA between first three tones of extinction and test, P (drug) = 0.58, P (time) < 0.0001, P (interaction) = 0.23; Student's t test for group comparison in the test session, P = 0.98).
