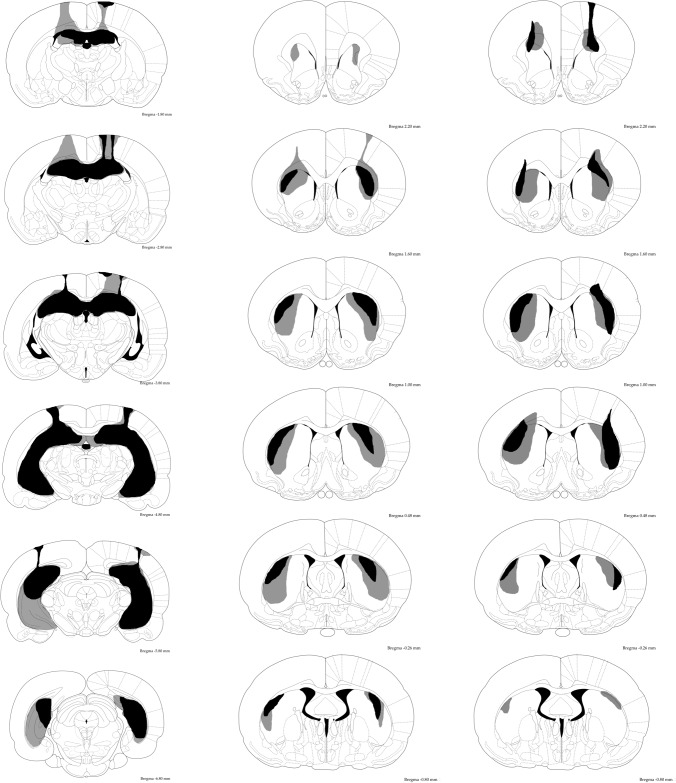
Figure 2.
Schematic representation of ibotenic acid lesions of HPC for Experiment 1 (left), DLS lesions for Experiments 1 and 2 (middle), and DLS lesions for Experiment 3 (right). The extent of damage from subjects bearing the maximum and minimum volume of damage in each group is represented in light gray and black, respectively. Atlas plates are adapted from Paxinos and Watson (1998).

