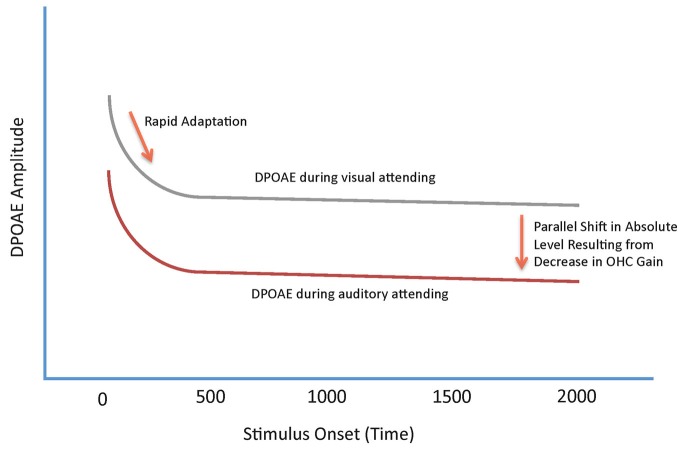
Figure 1.
Schematic summary of the effects of shifts in attention on DPOAE adaptation contours. The two contours represent the amplitude of the DPOAE as a function of time from primary tone onset. The upper, gray contour, represents a DPOAE contour measured during a visual gradient discrimination task. The lower, red, contour represents a DPOAE measured during an auditory attending task. Both contours show a rapid decrease in overall level following stimulus onset produced by rapid adaptation (RA). DPOAEs measured during visual attending tasks are, on average, higher in overall level compared with DPOAEs measured during auditory attending tasks. The difference in DPOAE contours between the two functions is observed as a parallel shift in overall amplitude.

