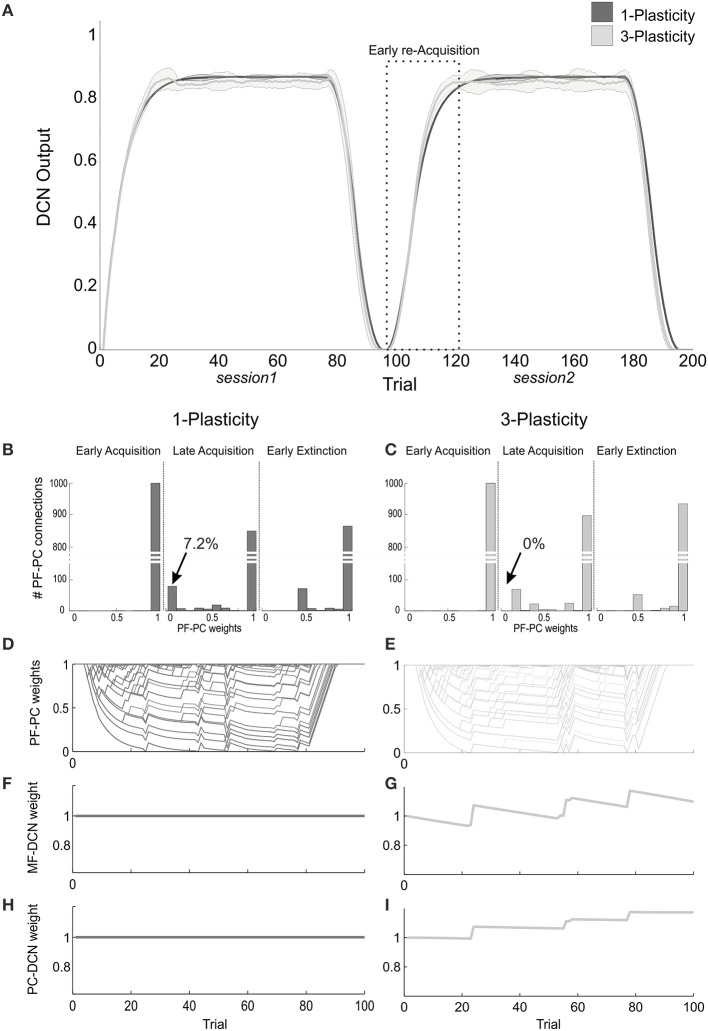
Figure 5.
Plasticity roles in real-robot Pavlovian task. (A) The two-session Pavlovian task, with ISI2. The curves are the maximum DCN output within each trial, averaged on the 20 tests, and the areas are the standard deviations. Dark gray: 1-plasticity model; light gray: 3-plasticity model. (B,C) For each model, histograms of the PF-PC weights at the end of three trials (1st, 80th, and 85th), in one of the 20 tests. The arrows indicate the percentages of saturated LTD at PF-PC synapses (weights = 0) at the 80th trial. For the 1-plasticity model, a considerable number of PF-PC connections is saturated to zero, on the contrary for the 3-plasticity model none of the connections is saturated. (D,E) For each model, PF-PC weights at the end of each trial of the test. Here each of the 1000 PF-PC synapses corresponds to one line (there are a lot of overlap, i.e., PF-bundles, as explained in the Results). (F,G) For each model, MF-DCN weight at the end of all trials of the test. The value is fixed for the 1-plasticity model. (H,I) For each model, PC-DCN weight at the end of all trials of the test. The value is fixed for the 1-plasticity model.

