
Fig. 8.
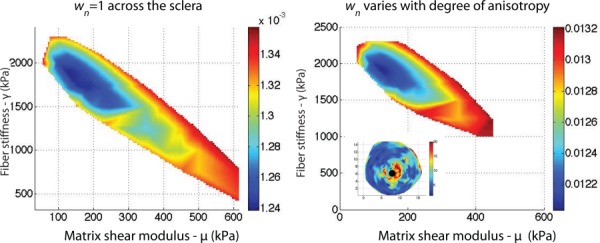
(a) Contour of the cost function in the (μ, γ)-space with wn = 1 for each node (Eq. (2)). (b) Contour of the cost function in the (μ, γ)-space with wn chosen to reflect the degree of anisotropy of the closest WAXS measurement. The weights are represented in the figure on the bottom left. The contribution of the nodes of the peripapillary sclera to the cost function was larger than those of the midposterior sclera. The cost function is represented between its minimum value m and 1.1 m.