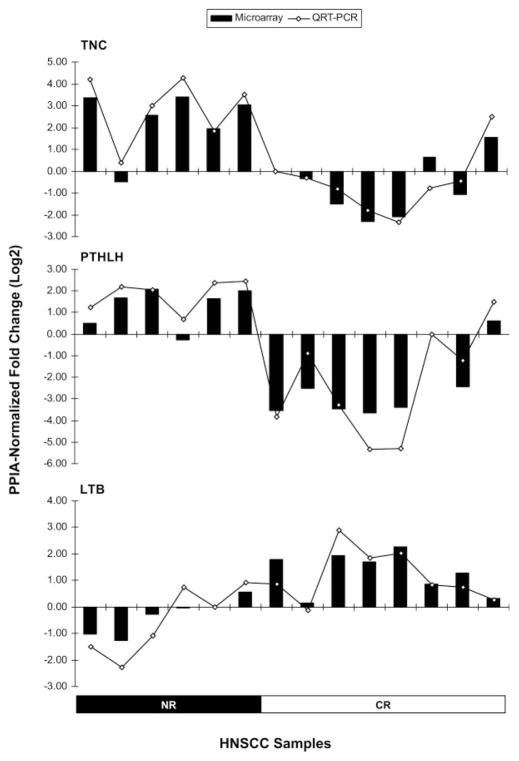
Fig. 5.
QRT-PCR gene expression validation. Relative gene expression of the TNC, PTHLH, and LTB genes in the 14 HNSCC samples, measured by Affymetrix gene expression arrays (bar chart) and by TaqMan chemistry (line chart). The PPIA-normalized fold changes (Log2) were calculated against an arbitrarily chosen sample from this cohort.

