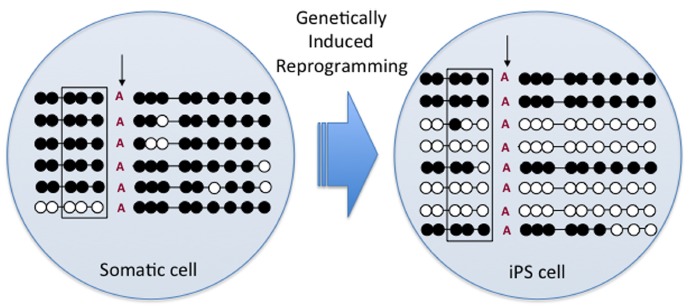
FIGURE 2.

DNA methylation pattern of the paternal H19/IGF2 DMR in hybrid fibroblasts (somatic cell) and induced pluripotent stem (iPS) cells. Circles represent methylated (black) and non-methylated (white) CpGs on the paternal allele DMR as confirmed by a Bos indicus-specific SNP (vertical arrow). Square indicates location of the CTCF binding site also indicating significant de-methylation after iPS cell reprogramming.
