
Figure 1.
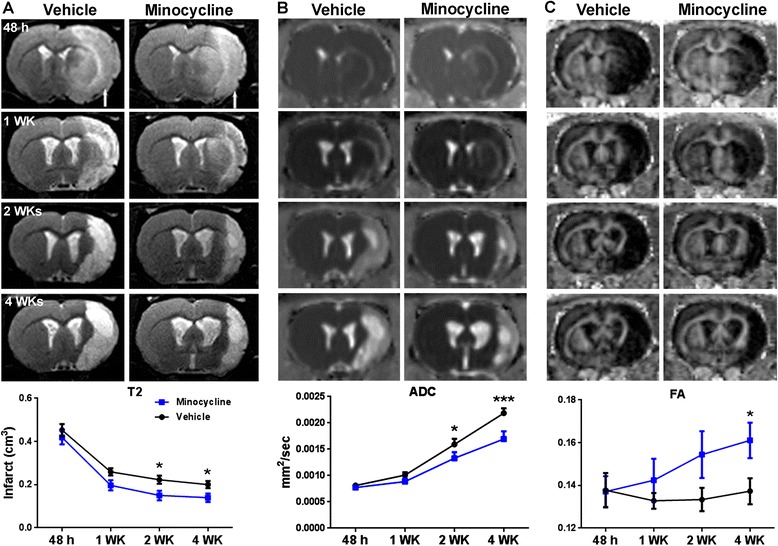
Stroke recovery monitored by magnetic resonance imaging. A. Anatomical T2 MR images. Arrows indicate ischemic hemispheres. Line graph demonstrates quantification of infarct volumes in ischemic hemispheres. B. ADC maps. Line graph demonstrates quantification of edema (acute stage) and tissue loss (late stage) in ischemic hemispheres. C. FA maps. Line graph demonstrates quantification of white matter change in ischemic hemispheres. *P <0.05, ***P <0.001 versus vehicle group, n = 8 in each group.