
Figure 2.
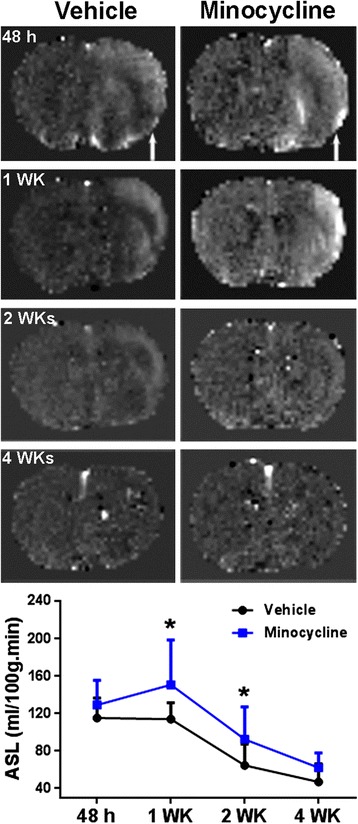
ASL maps monitored by MRI at 48 hours and one, two and four weeks after stroke. Arrows indicate ischemic hemispheres. Line graph demonstrates quantification of blood flow in peri-infarct areas. *P <0.05 versus vehicle group, n = 8 in each group.