Fig. 1.
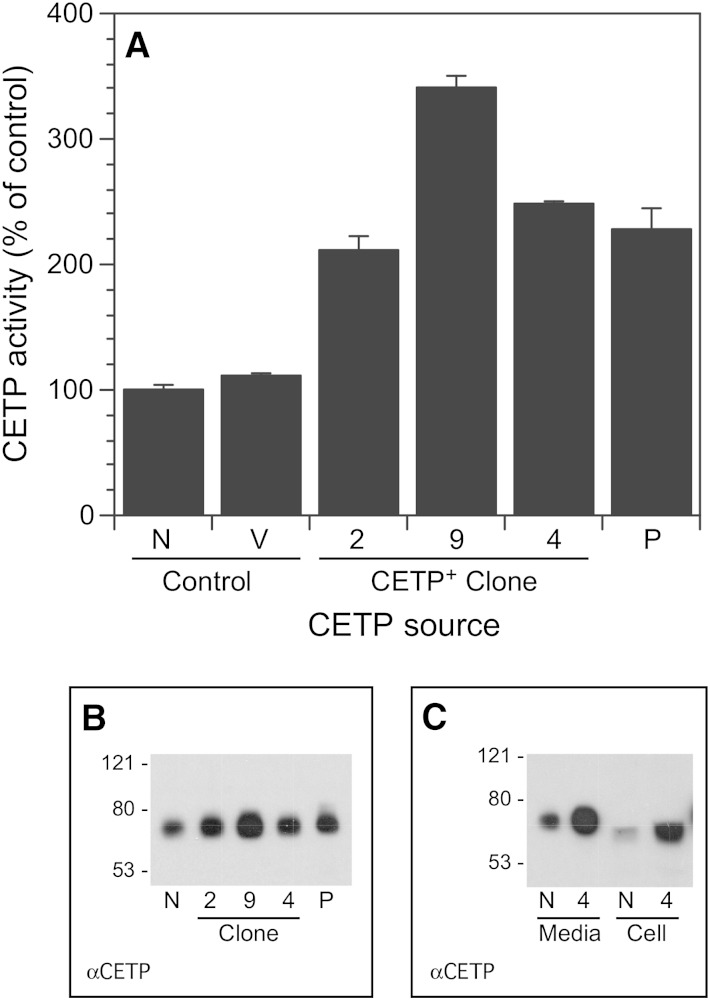
CETP expression by CETP+ clones. A: CETP activity in media incubated with the indicated cells for 48 h. Lipid transfer activity in control cells was 19.7 ± 0.8%/ml (t = 16 h). B: CETP Western blot of the conditioned media assayed in A. In A and B, media aliquots were normalized to the number of cells per well. C: CETP Western blot of conditioned media and cell homogenates (25 µg protein). N, native SW872 cells; P, partially purified CETP from plasma; V, vector-transfected SW872 cells. Numerical designations refer to the CETP+ clone number.

