Fig. 3.
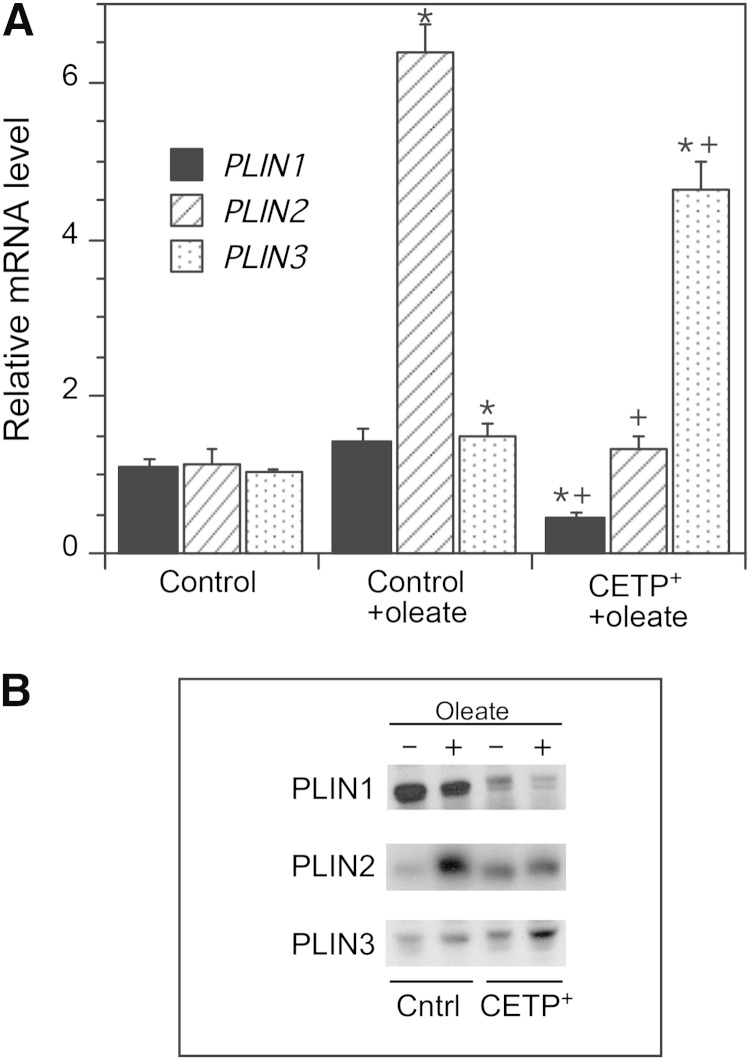
Perilipin gene expression and protein levels. A: Native SW872 and CETP+ cells were grown in 200 µM oleate for 48 h to induce lipid droplet formation. mRNA levels determined by qPCR are shown for PLIN1, PLIN2, and PLIN3. SW872 cells grown in the absence of added oleate were used as reference. Values are the mean ± SD of the values determined on RNA isolated from two to three separate cell cultures. * P < 0.05 versus control; + P < 0.05 versus oleate-treated control. B: Western blot of perilipins in the 100,000 g supernatant isolated from vector-transfected SW872 (Cntrl) and CETP+ cells. Cells were grown with or without oleate as described in A.

