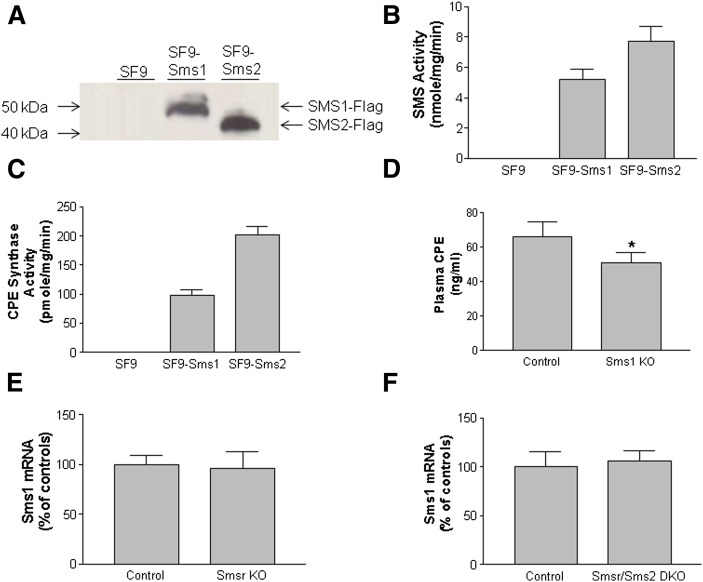
Fig. 6.
Mouse SMS1 and SMS2 have CPE synthase activity. A: SF9 insect cells were transfected with Sms1-Flag or Sms2-Flag, and Western blot was performed using anti-Flag antibody. B: SMS activity in SF9 insect cells transduced with Sms1-Flag and Sms2-Flag. C: CPE synthase activity in SF9 insect cells transduced with Sms1-Flag and Sms2-Flag. Values are mean ± SD of three experiments. D: Plasma CPE levels in Sms1 KO and control mice. E: SMS1 mRNA, measured by real-time PCR, in the liver of Smsr KO mice. F: SMS1 mRNA, measured by real-time PCR, in the liver of Smsr/ Sms2 bouble KO mice. Values are mean ± SD of five mice. *P < 0.05.

