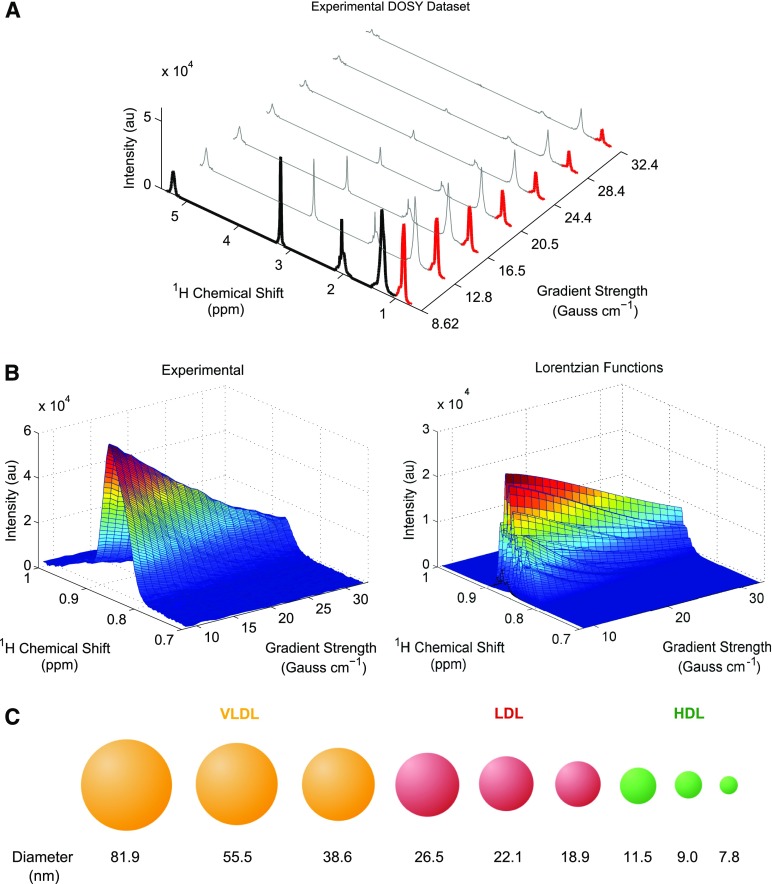
Fig. 1.
Overview of the Liposcale test. A: Experimental DOSY spectra. Seven gradients out of 32 total are shown for visualization purposes. The first gradient has been filled in black to show the NMR regions of the spectra that are used to calibrate and predict cholesterol and triglyceride concentrations using PLS regression. In red, we show the attenuation of the methyl NMR signal along the gradient axis to show the region used to characterize the different lipoprotein subclasses. B: Surface fitting process for a given subject. The experimental attenuation of the methyl NMR signal (left) and the nine NMR functions used to fit the experimental surface (right). C: Using this methodology, we can elucidate nine lipoprotein subclasses, namely large, medium, and small VLDL, LDL, and HDL.

