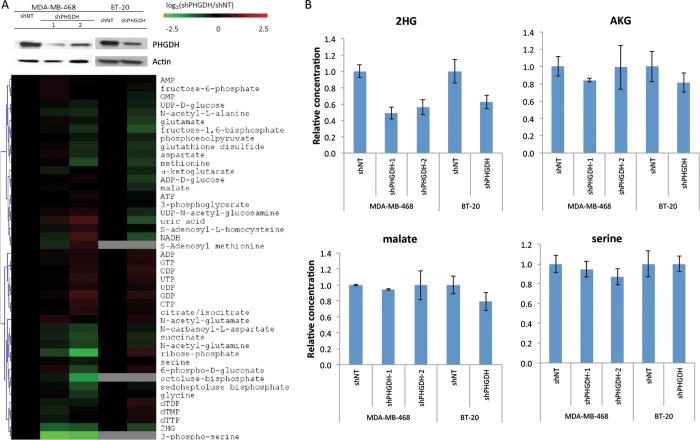
Figure 2.
PHGDH knockdown in MDA-MB-468 and BT-20 cells depletes 2HG. (A) Validation of PHGDH knockdown by western (top) and heat map of metabolite levels revealing depletion of 2HG and 3-phosphoserine (bottom). Metabolite levels were averaged and normalized to cell number/volume (which were equivalent as cell size did not change with PHGDH knockdown), then normalized to shNT of the corresponding cell line. Results are log2 transformed and clustered. (B) Relative concentrations of key metabolites in two PHGDH-amplified breast cancer cell lines with shPHGDH or control knockdown.

