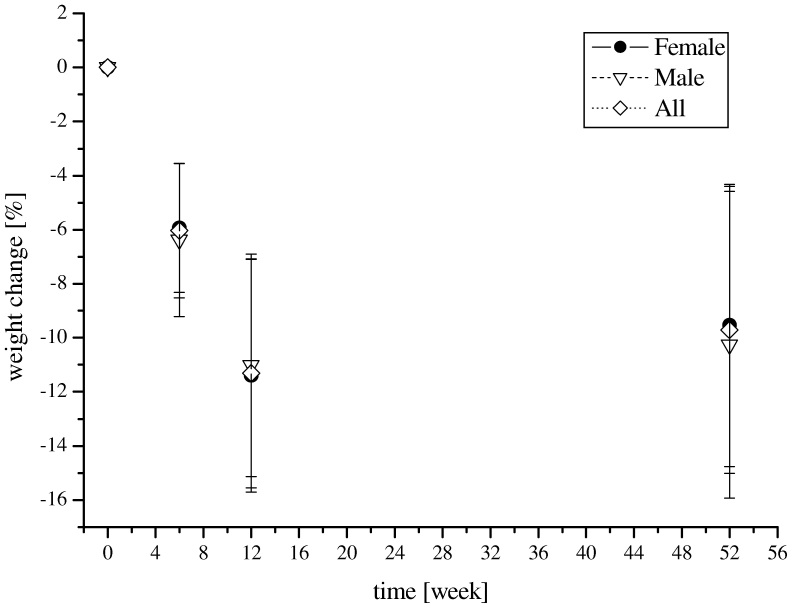
Figure 1. The percentage changes in body mass among studied individuals.
*Friedman test showing summarized effect for the all time points; comparisons between each time points showed Dunn's Multiple Comparison test: 0 wk vs 6 wk P < 0.05; 0 wk vs 12 wk P < 0.05; 0 wk vs 52 wk P < 0.05; 6 wk vs 12 wk P < 0.05; 6 wk vs 52 wk P < 0.05; 12 wk vs 52 wk P > 0.05.

