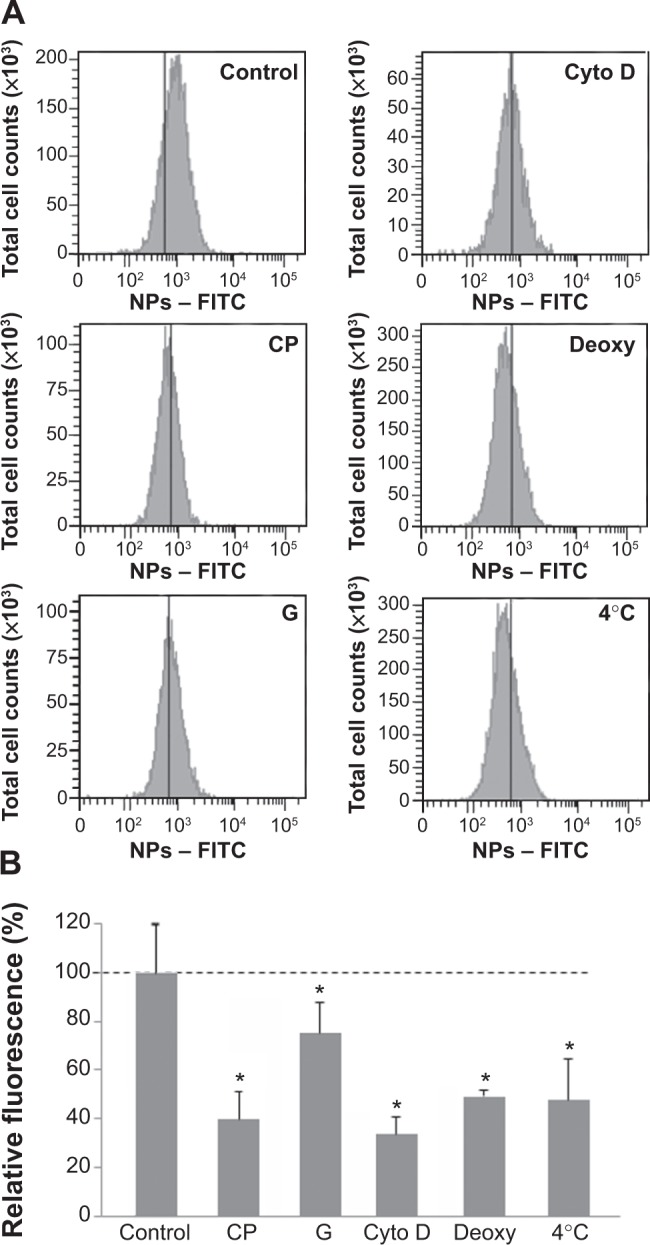
Figure 2.

Effect of endocytosis inhibitors on cellular uptake of NPs.
Notes: Cells were pretreated at 37°C with chlorpromazine (CP), genistein (G), cytochalasin D (cyto D), sodium azide, and 2-deoxy-D-glucose (deoxy) for 30 minutes and then exposed to NPs (3 μg/cm2) and inhibitors for 30 minutes. Cells maintained at 4°C were exposed to NPs for 30 minutes after 30 minutes of preincubation at 4°C. Quantification of internalization was performed by flow cytometry, after addition of trypan blue. (A) Flow cytometry analysis of FITC-NPs uptake by treated cells. (B) Percentage of uptake relative to untreated cells exposed to NPs. This was calculated by dividing the mean cell fluorescence intensity after NP uptake in drug-treated cells by that of untreated cells. Untreated cells at 37°C ± standard error of the mean. Bars on the graph represent the standard of the mean. *Significantly different from the control (P≤0.05); n=3.
Abbreviation: NP, silica nanoparticle.
