
FIGURE 6.
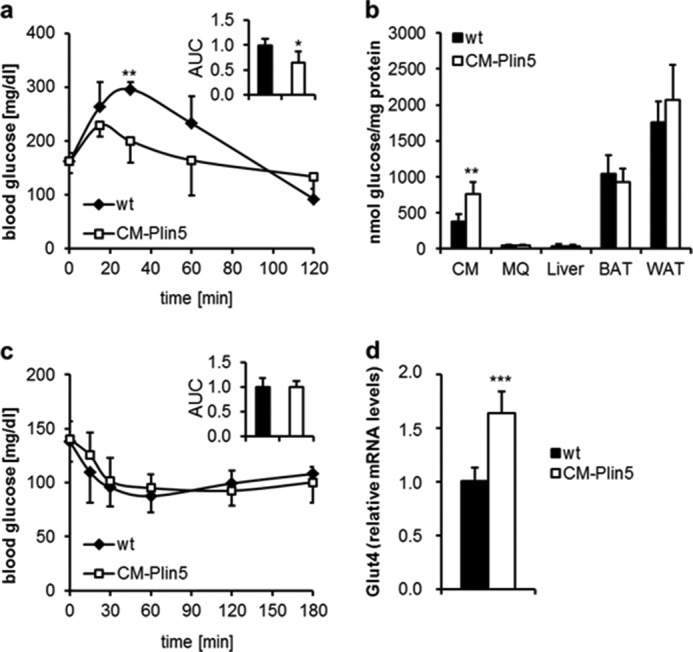
Changes in glucose homeostasis in CM-Plin5 transgenic mice. a, glucose tolerance test of 12-week-old 6-h fasted WT and CM-Plin5 mice (n = 5, normalized area under the curve (AUC)). b, tissue-specific glucose uptake determined in 16-week-old 6-h fasted mice (n = 5) using [2-3H]deoxyglucose as radioactive tracer. c, insulin tolerance test of 14-week-old 4-h fasted mice (n = 5). d, relative mRNA levels of glucose transporter 4 (Glut4) in CM of fasted WT and CM-Plin5 mice, determined by quantitative RT-PCR (n = 6). Data are shown as mean ± S.D. *, p < 0.05; **, p < 0.01 and ***, p < 0.001 versus WT control.