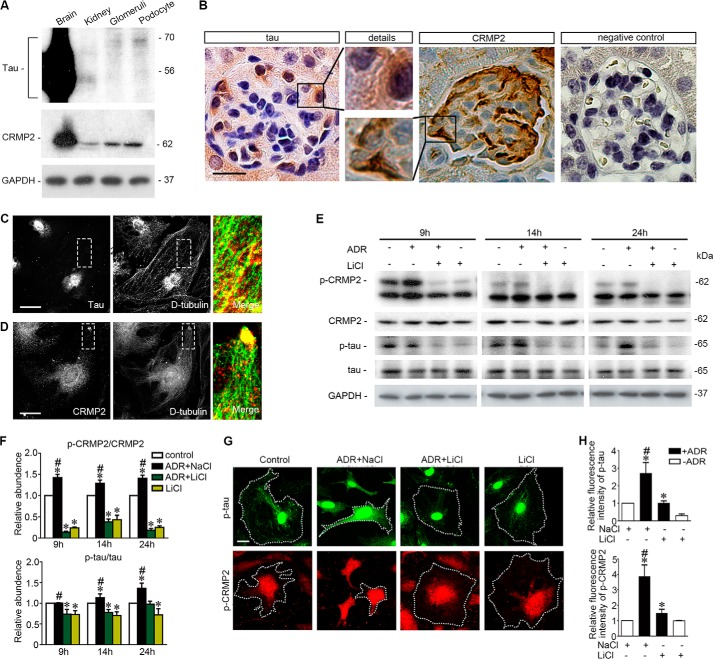
FIGURE 3.
Microtubule-associated proteins Tau and CRMP2 are evidently expressed in podocytes in glomeruli, associated with microtubules, and regulated by adriamycin or lithium treatment. A, homogenates of mouse brain, kidney, isolated mouse glomeruli, and lysates of the differentiated mouse podocytes in culture were subjected to immunoblot analysis for Tau and CRMP2. Note that the long forms of Tau were probed as the major forms in isolated glomeruli and in cultured podocytes, whereas the short forms of Tau predominated in whole kidney homogenates. B, representative micrographs of peroxidase immunohistochemistry staining of mouse kidney for Tau and CRMP2 in glomeruli. Immunoperoxidase staining of Tau and CRMP2 was consistent with a pattern of podocyte-specific distribution. The primary antibody was replaced by nonimmune serum from the same species as a negative control, and no staining occurred. Bar, 20 μm. C, representative micrographs of dual color fluorescent immunocytochemistry staining of the differentiated mouse podocytes in culture indicated an association of Tau with stable microtubules as probed by detyrosinated tubulin (D-tubulin). Tau was closely associated with microtubule along the whole length. Bar, 10 μm. D, representative micrographs of dual color fluorescent immunocytochemistry staining of the differentiated mouse podocytes in culture indicated an association of CRMP2 with stable microtubules as probed by detyrosinated tubulin (D-tubulin). CRMP2 was associated with microtubules and clustered at the leading edge of podocyte extensions. Bar, 10 μm. E, after ADR (0.25 μg/ml) or vehicle treatment for 8 h, conditionally immortalized mouse podocytes were treated with or without lithium chloride (10 mm) or sodium chloride (10 mm) for 1, 6, and 16 h corresponding to 9, 14, and 24 h post-ADR injury. Cells were harvested at the indicated time points, and cell lysates were subjected to immunoblot analysis for the indicated proteins. F, arbitrary units of p-CRMP2/CRMP2 ratios or p-Tau/Tau ratios expressed as immunoblot densitometric ratios of the molecules as folds of the control group. *, p < 0.05 versus control group; #, p < 0.05 versus ADR + LiCl group, (n = 3 representative experiments). G, representative micrographs of fluorescent immunocytochemistry staining of phosphorylated Tau and phosphorylated CRMP2 in podocytes 14 h following different treatments as stated in Fig. 2A. Bar, 5 μm. H, morphometric analysis of relative fluorescence intensity of p-Tau and p-CRMP2 in podocytes. *, p < 0.05 versus control group; #, p < 0.05 versus ADR + LiCl group; (n = 6).

