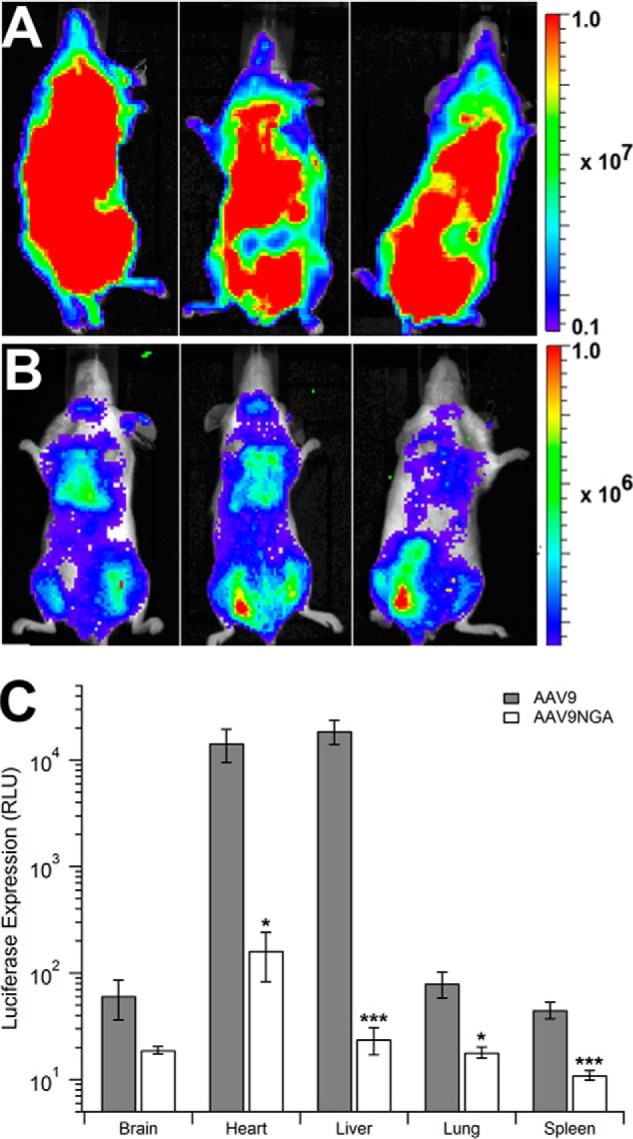
FIGURE 1.

In vivo transduction profile of the AAV9NGA mutant in mice. BALB/c mice (n = 3) were injected intravenously with AAV9 (A) or AAV9/NGA (B) vectors (1 × 10¹¹ vg/mouse) through the tail vein. Luciferase transgene expression patterns in mice were imaged using a Xenogen IVIS Lumina® system 3 weeks post-injection. Note that the rainbow scale indicates total flux (photons/second/square centimeter/steradian) and is displayed at an order of magnitude lower in B compared with A. To quantify luciferase expression (C), mice subjected to live animal imaging were sacrificed at 3 weeks, and different tissues were harvested for analysis. Tissue lysates from AAV9-treated (gray columns) or AAV9NGA-treated (white columns) animals were subjected to luminometric analysis using a Victor2® luminometer and normalized to the mass of each tissue sample. Error bars represent mean ± S.E. *, p < 0.05; ***, p < 0.005. RLU, relative light unit(s).
