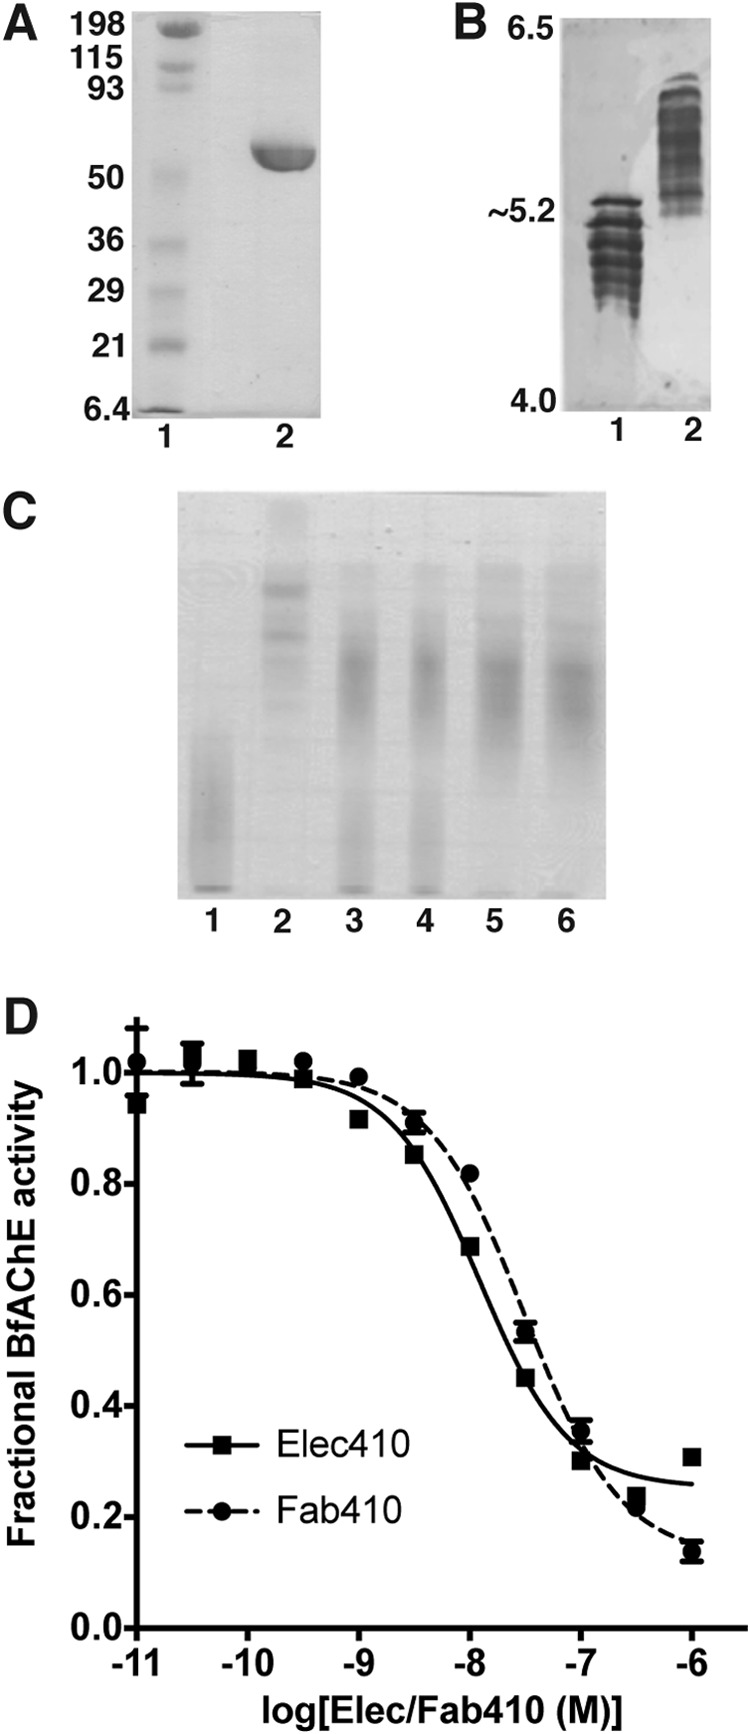
FIGURE 1.

Functional and electrophoretic characterization of BfAChE and its Elec410 and Fab410 complexes. A, SDS-PAGE of BfAChE (non-reducing conditions; 12.5% PhastGel). The molecular weight markers are displayed and labeled. B, comparative isoelectric focusing analysis of mAChE (lane 1) and BfAChE (lane 2) (pI 4.0–6.5 PhastGel). The pI limits of the gel are indicated. BfAChE is as heterogeneous in charge as mAChE, but it displays higher overall pI value. C, native PAGE (7.5% PhastGel) of BfAChE (lane 1), Fab410 (lane 2), and pre-incubated Fab410/BfAChE mixtures in a 0.75:1, 0.9:1, 1:1, and 1.2:1 molar ratio (lanes 3–6) with migration from the cathode (top) toward the anode (bottom). The cationic character of Fab410 is evident. Both BfAChE and Fab410 are homogenous in mass but not in charge, due to heterogeneous N-glycosylation of natural BfAChE (38, 67) and nonspecific C-terminal processing of Fab410 by papain (32); however, all isoforms form complexes as assessed by the inhibition curves (D; below) and further verified by analytical gel filtration (not shown). D, inhibition of BfAChE by Elec410 and Fab410 at equilibrium (individual experiments). Data points correspond to the average ± variation of duplicates. Non-linear fitting used a sigmoidal equation. The slight difference in the IgG (squares) and Fab (circles) affinities for BfAChE may reflect their relative avidity. The significant residual (fractional) activity of BfAChE at near saturating concentrations of Elec410 or Fab410 is evident. Mean IC50 and residual activity values from three to four independent experiments are reported in Table 1 as are those for the inhibition of EeAChE.
