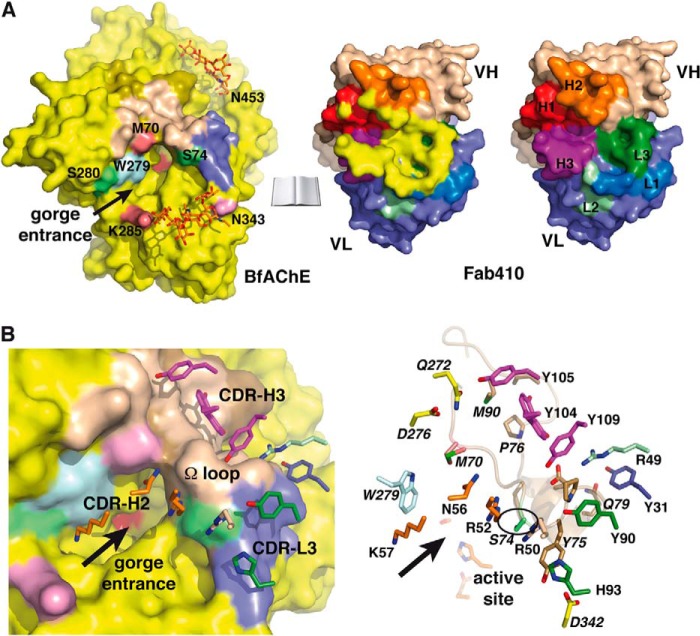
FIGURE 5.
The Fab410-BfAChE complex interface. A, overall views of the buried interfaces at the molecular surfaces of BfAChE (left) (same color codes as in Figs. 3A and 4A) and Fab410 (center) (yellow buried surface overlaid onto the CDRs colored as in Figs. 3A and 4A and in the right panel) in the complex (molecules oriented 90° from each other; not drawn on scale). The positions for Met70 and Lys285, which distinguish the PAS of BfAChE from those of other AChEs, are shown in violet; that for Trp279 (Trp279/280/286 in TcAChE/EeAChE/mAChE) is in light blue; those for Ser74 and Ser280, corresponding to EeAChE Ser75 and Leu282 whose substitution by rat AChE residues alters Fab410 binding, are in green; and that for Asn343, corresponding to EeAChE Asn345 whose deglycosylation enhances Fab410 binding, is in pink. Right, the Fab410 combining surface with only the colored CDRs. B, close-up views of the Fab410-BfAChE complex interface with (left) and without (right) the molecular surface of BfAChE showing the key BfAChE residues (italicized labels; encircled Ser74) and Fab410 CDR residues (same orientation and color codes as in A with red oxygen and blue nitrogen atoms). The arrows point to the BfAChE active site gorge entrance.

