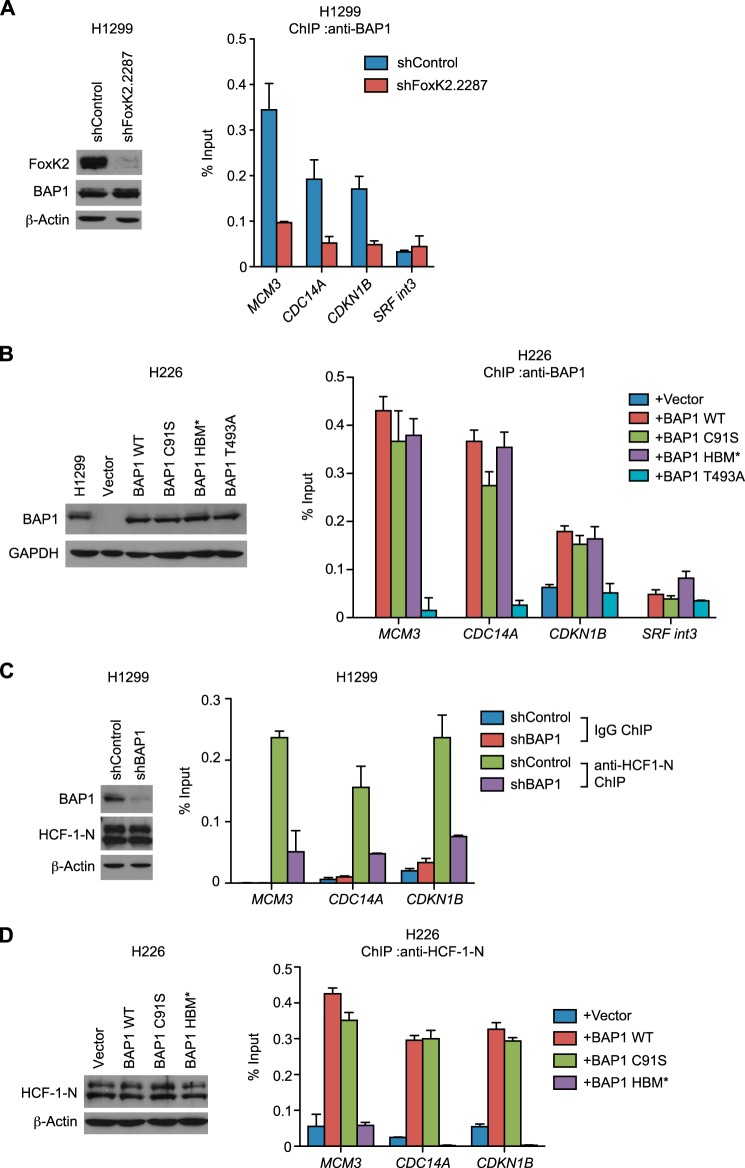
FIGURE 3.
Recruitment of BAP1 and HCF-1 to FoxK2 binding regions. A, recruitment of BAP1 to FoxK2 target genes. ChIP using anti-BAP1 antibodies was performed with control and FoxK2-depleted H1299 cells. Expression levels of FoxK2 and BAP1 assessed by Western blotting are shown in the left panel. B, recruitment of various BAP1 mutants to FoxK2 target genes. BAP1 mutants were expressed at endogenous levels in the H226 BAP1-deficient cell line, and ChIP was performed with anti-BAP1 antibodies. Expression levels of BAP1 assessed by Western blotting are shown in the left panel. H1299 is shown as a control for the endogenous BAP1 level. C, recruitment of HCF-1 to FoxK2 target genes. ChIP using anti-HCF-1-N antiserum was performed with control and BAP1-depleted H1299 cells. Expression levels of BAP1 and HCF-1-N assessed by Western blotting are shown in the left panel. D, ChIP analyses of HCF-1 recruitment in the H226 BAP1-deficient cell line expressing various BAP1 mutants. BAP1 mutants were expressed as in B, and ChIP was performed with anti-HCF-1-N antiserum. Expression levels of HCF-1-N were assessed by Western blotting and are shown in the left panel. β-actin and GAPDH served as loading controls in Western blotting. qPCR was done in triplicate, and mean ± S.D. is shown. In ChIP experiments, the amount of precipitated DNA at each region was expressed as a percentage of input.

