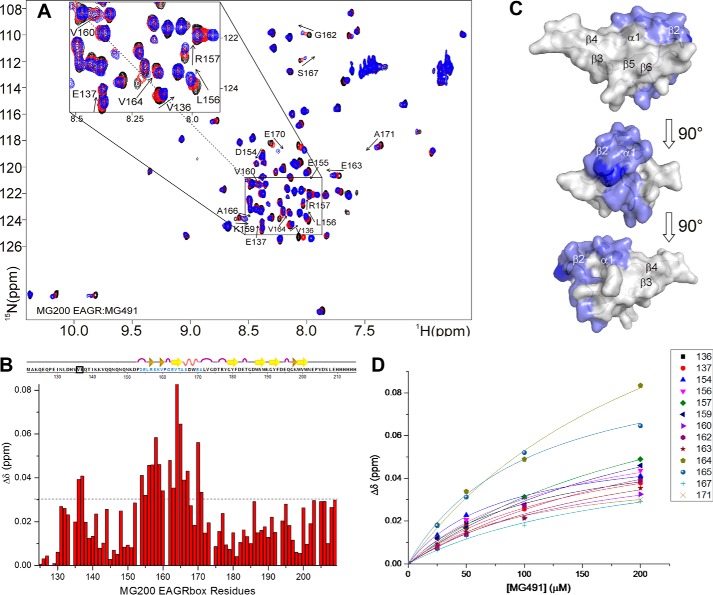
FIGURE 5.
Analysis of the chemical shift perturbations of the 15N-MG200 EAGR box in complex with MG491. A, superimposition of 1H,15N HSQC spectra of MG200 EAGR box in the absence and in the presence of MG491. MG200 EAGR box/MG491 complex ratios of 1:0, 1:4, and 1:8 are represented in black, red, and blue traces, respectively. Assigned residues showing an average CSP higher than 0.03 ppm are labeled. Very low intensity peaks are below the displayed threshold in some of the spectra. B, plots of the weighted average CSPs of backbone amide resonances of 15N-MG200 EAGR box between the initial and the final point of the titration with MG491 as a function of residue number. The horizontal dashed line indicates the selected CSP threshold. Residues showing an average CSP higher than 0.03 ppm in the presence of MG491 are highlighted in pale blue in the graphical representation of the secondary structure elements. Pro161 is highlighted in dark blue. Residues above the threshold cluster in the region spanning from residue Asp154 to Ala171, except for residues Val136 and Glu137 (surrounded by a black square). C, CSPs mapping of 15N-MG200 EAGR box residues upon the addition of MG491 on the surface of the MG200 EAGR box structure (PDB accession code 4DCZ). Residues showing an average CSP higher than 0.03 ppm in the presence of MG491 are colored according to B. D, fitting of the weighted average CSPs of selected backbone amide resonances of 15N-MG200 EAGR box as function of the concentration of unlabeled MG491. The average KD for the adduct is 170 ± 40 μm.

