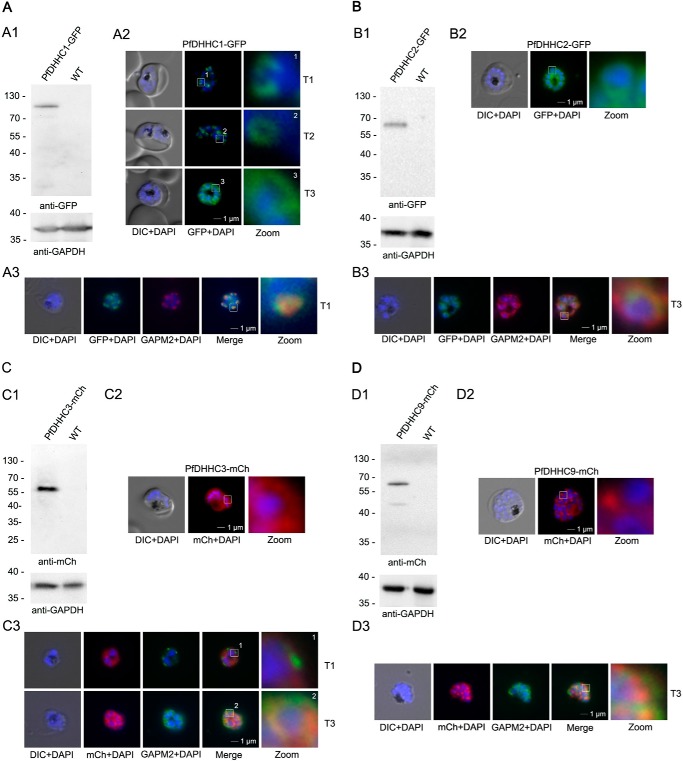
FIGURE 1.
Overexpression and localization of PfDHHC1 (PFC0160w), PfDHHC2 (PFF0485c), PfDHHC3 (PF11_0217), and PFDHHC9 (PF11_0167) in late stage parasites. A, expression of PfDHHC1-GFP. Panel A1, Western blot analysis using anti-GFP antibodies. A single protein band of about 100 kDa (expected mass of 100 kDa) was detected in the transgenic but not in the parental parasite line. Panel A2, localization of PfDHHC1-GFP in unfixed parasites showing characteristic IMC dynamics during schizogony as follows: commencing as cramp-like structures (T1) and transforming to small ring-shaped formations (T2) that toward the end of schizogony expand and are then equally distributed underneath the plasma membrane (T3). Nuclei are stained with DAPI (blue). Enlargement of selected areas are marked with a white square and referred to as zoom. Scale bar, 1 μm. Panel A3, co-localization with the IMC marker GAPM2 (anti-GAPM2, red) in fixed cells confirmed PfDHHC1-GFP IMC localization shown here in an early stage of IMC biogenesis (T1). B, expression of PfDHHC2-GFP. Panel B1, Western blot revealed a 65-kDa (expected mass of 59 kDa) protein band detected by anti-GFP antibodies in the transgenic cell line but not in the control. Panel B2, live microscopy of PfDHHC2-GFP revealed a circular structure around the nucleus of the nascent merozoites reminiscent of the ER. Scale bar, 1 μm. Panel B3, co-localization with the IMC marker GAPM2 (anti-GAPM2, red) in fixed cells shows differential localization of PfDHHC2-GFP with the IMC shown here as nascent merozoites (T3). C, expression of PfDHHC3-mCherry. Panel C1, Western blot analysis with anti-mCherry antibody detected a 60-kDa (expected mass of 61 kDa). Panel C2, microscopic analysis located this GFP fusion protein in the periphery of the nascent merozoites. Panel C3, co-localization with the IMC marker GAPM2 (anti-GAPM2, green) in fixed cells shows differential localization of PfDHHC2-mCherry with the IMC localization in early stages (T1) and co-localization in nascent merozoites (T3) consistent with plasma membrane association. Scale bar, 1 μm. D, expression of PfDHHC9-mCherry. Panel D1, expression leads to 60 kDa and some degraded protein at about 45 kDa protein (expected mass of 61 kDa) detected in Western blot analysis using mCherry antibodies. Panel D2, microscopy localized this fusion protein mainly in apical structures in the parasite. Panel D3, co-localization with the IMC marker GAPM2 (anti-GAPM2, green) in fixed cells shows differential localization of PfDHHC9 with the IMC (T3). DIC, differential interference contrast. Scale bar, 1 μm.

