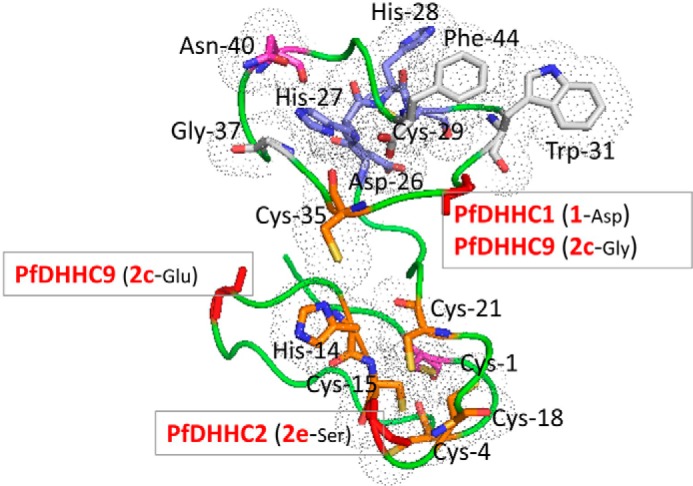
FIGURE 10.

Structural model for the CRD region. Based on PfDHHC7 (PF3D7_0528400, 2dH), a model was generated using I-TASSER (65), the best performing web server for protein structure prediction according to the community-wide Critical Assessment of Protein Structure Prediction (CASP) experiment (66). The fit of the sequence to the modeled structure was verified using PROSA (67), which returned a Z-score of −4.54, comparable with those observed for experimental structures of this size. The conserved residues of the CRD region are shown as sticks. The different residues are colored as follows: DHHC motif in blue, invariant Cys-1 and Asn-40 in magenta, highly conserved Cys and His residues in orange, and the largely conserved Gly-37, Trp-31, and Phe-44 in white. The residues are marked according to the number shown in the consensus sequence logo for the CRD region in Fig. 3. The backbone of cluster defining residues for the PATs of interest are shown as red sticks.
