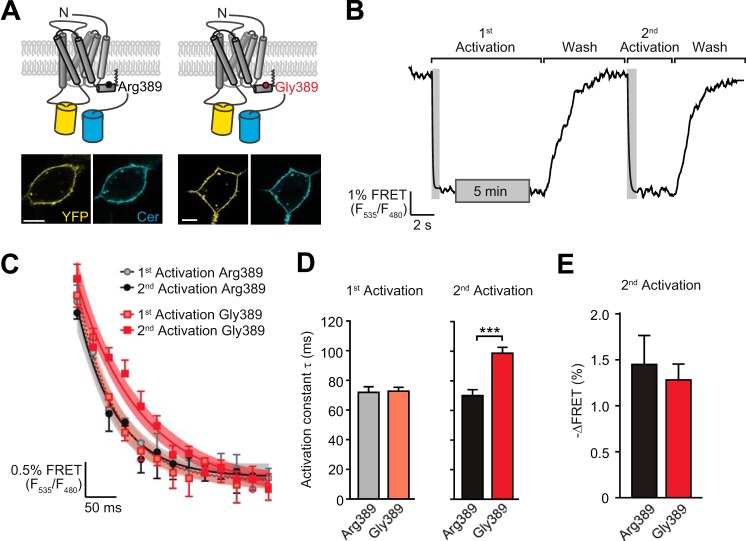
FIGURE 3.
The hyperfunctional Arg-389-ADRB1 exhibits faster activation compared with Gly389-ADRB1. A, topology of the polymorphic ADRB1-FRET sensor constructs and their subcellular localization upon expression in HEK293 cells. Scale bars = 10 μm. YFP fluorescence is depicted in yellow and Cer in cyan. B, schematic of the experimental approach investigating ADRB1 activation kinetics upon repeated stimulation. C, activation kinetics of the ADRB1-FRET sensor variants Arg-389 and Gly-389 upon repeated stimulation with 100 μm NE. The first stimulation was carried out for 5 min and the second stimulation directly after complete washout of the agonist. Time constants were determined by fitting monoexponential curves to the first (dashed line) and second (continuous line) activation. Curves were fitted to plot the mean ± S.E. of the first and second activation (n = 4–5). 95% confidence intervals are displayed as shaded areas. D, time constants of the first (left panel) and second (right panel) activation (n = 14–20). ***, p < 0.001; Student's t test. E, FRET ratio of the second activation.

