FIGURE 7.

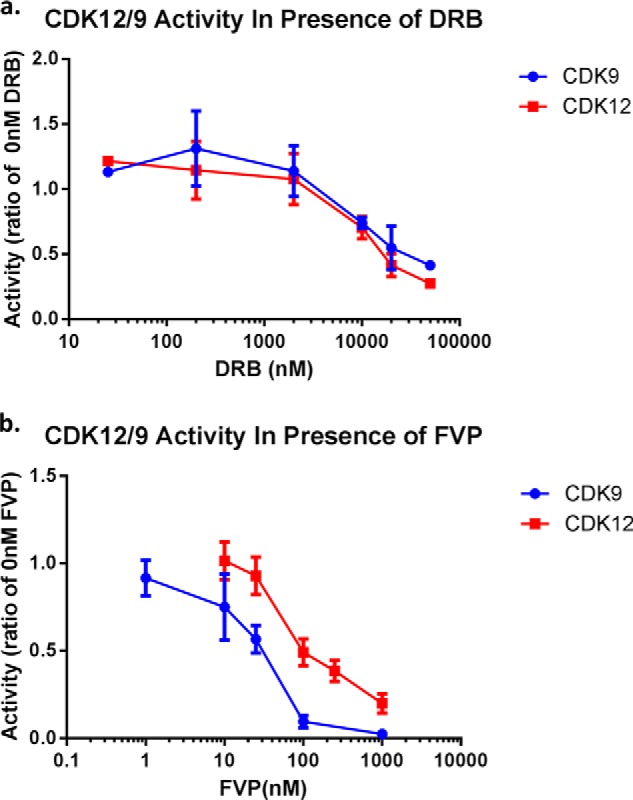
CDK9 and CDK12 activity in the presence of DRB and FVP. Concentration series of (a) DRB and (b) FVP for CDK12/CycK and CDK9/CycT1 activity assayed using 1 μg of GST-yCTD (30 μm ATP, 37 °C, 30-min reaction time). Activity of each kinase is normalized to a value of one for 0 nm DRB or 0 nm FVP, respectively. Error bars are ± 1 S.E. of the mean, n = 3 (except for DRB 25 nm and 5000 nm where n = 1 and 2, respectively).
