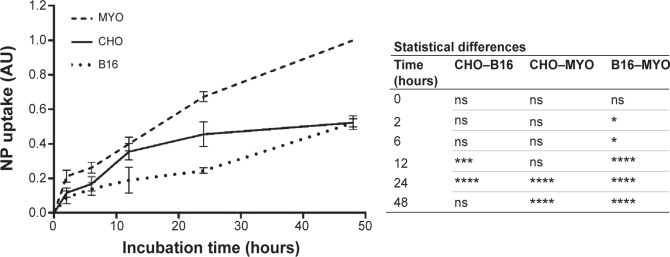
Figure 6.

Quantification of time-dependent uptake of RITC-labeled PAA-coated NPs.
Notes: CHO, B16, and MYO cells were incubated with 100 μg/mL NPs for different time intervals (0, 2, 6, 12, 24, and 48 hours), and fluorescence intensity was measured spectrofluorimetrically. Results are presented as measured RITC fluorescence normalized to the highest measured fluorescence in each experiment (MYO cells after 48 hours of incubation). Mean and standard error are shown for four independent experiments. Statistical differences between all three cell types for each time point are shown in the table on the right. Statistical significance is displayed as follows: ns is not significant (P>0.05); *P≤0.05; ***P≤0.001; ****P≤0.0001.
Abbreviations: B16, mouse melanoma cell line; CHO, Chinese Hamster Ovary cell line; MYO, primary human myoblasts; NP, nanoparticle; PAA, polyacrylic acid; RITC, rhodamine B isothiocyanate.
