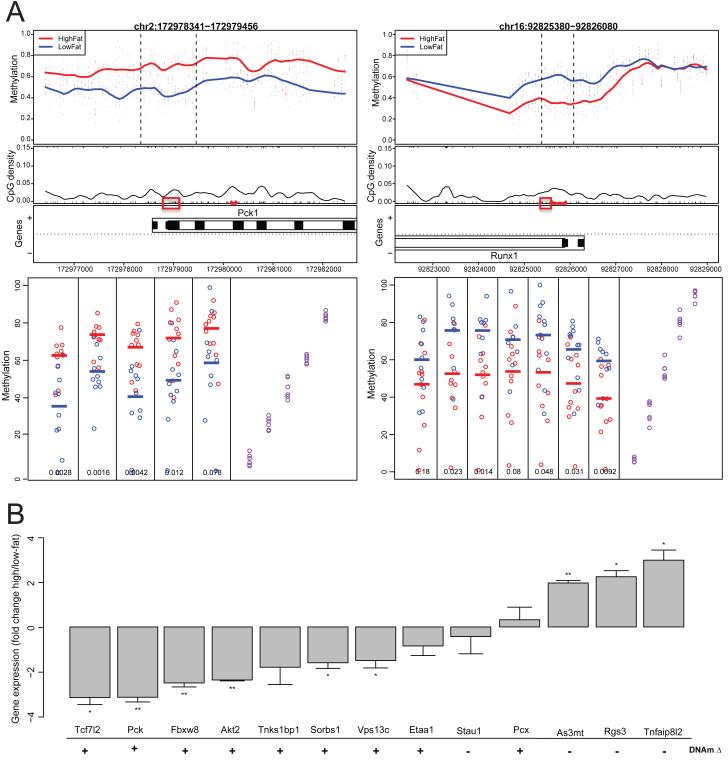
Figure 2. Replication of mouse methylation changes in additional mice, and associated gene expression changes.
(A) Methylation changes observed after CHARM analysis at two genome-wide significant DMRs are replicated using bisulfite pyrosequencing. Red boxes indicate CpGs assayed in pyrosequencing. For the lower pyrosequencing plots, the y-axis represents methylation, and individual CpGs are plotted along the x-axis. Purple dots represent control DNA artificially methylated to have 0, 25, 50, 75 and 100% methylation. (B) Gene expression changes for genes near genome-wide significant mouse adipocyte DMRs. RNA levels were normalized to same-sample 18S RNA measurements and are displayed as [CT (high-fat samples) – CT (low-fat samples)]2. Error bars represent standard error of the CT differences between groups. * p<0.05, ** p<0.005, *** p<0.0005. The direction of the genome-wide significant CHARM DMR closest to the gene is denoted below the gene names; + and − represent regions hyper- or hypomethylated in the high-fat samples, respectively. See also Figure S2 for whole-genome gene expression correlations, and Tables S4 and S5 for pyrosequencing and tissue purification, respectively.

