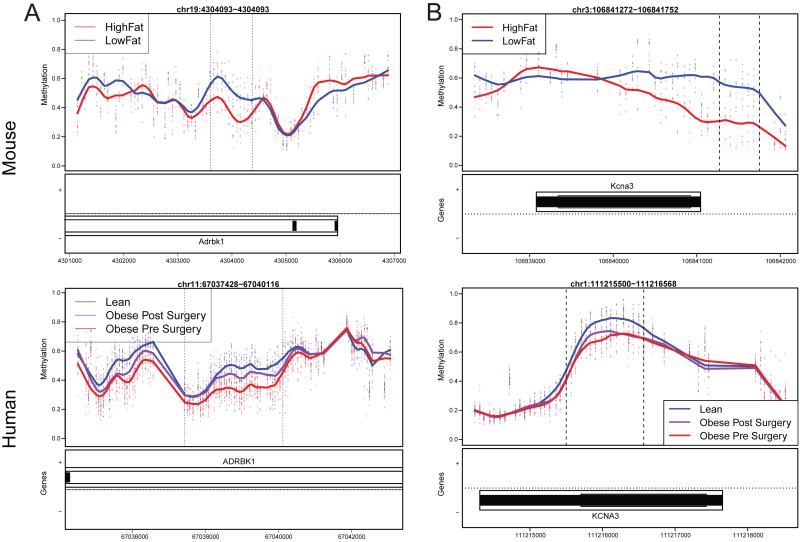
Figure 3. Overlapping methylation changes in human and mouse adipose tissue.
Two genome-wide significant DMRs found in mouse adipocytes over Adrbk1 (A, top) and Kcna3 (B, top) are shown along with the corresponding methylation changes in human adipose tissue in (A, bottom), and (B, bottom). For the panels denoting methylation, each point represents the methylation level from an individual mouse or human at a specific genomic location, with smoothed lines representing group methylation averages. Y-axis – methylation values. Below each methylation plot is a panel showing genomic coordinates for the respective species and any genes at those coordinates. See also Figure S3 for tissue and species overlaps, and Tables S6 and S7 for conserved adipose mouse DMRs in human and for enrichment between DIAGRAM and conserved DMRs, respectively.

