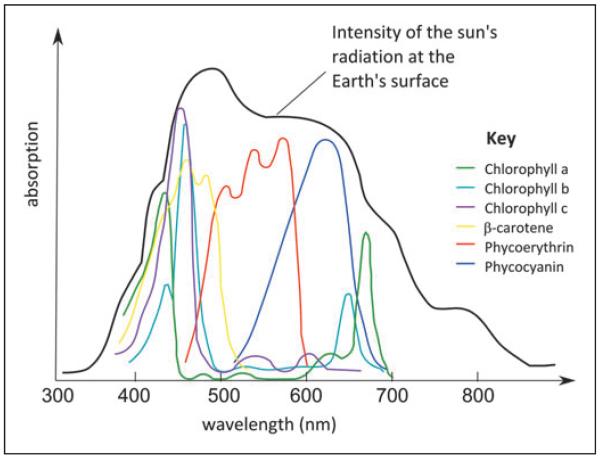
Fig. 1.
Absorption spectra of pigments present in algae shown in comparison to the intensity of the sun’s radiation at the Earth’s surface. In vivo absorption spectra are shown for chlorophyll a (λmax = 435, 665 nm), chlorophyll b (λmax = 480, 650 nm), chlorophyll c (λmax = 645 nm), β-carotene (λmax = 450 nm), phycoerythrin (λmax = 490, 546, 576 nm), and phycocyanin (λmax = 618 nm).

