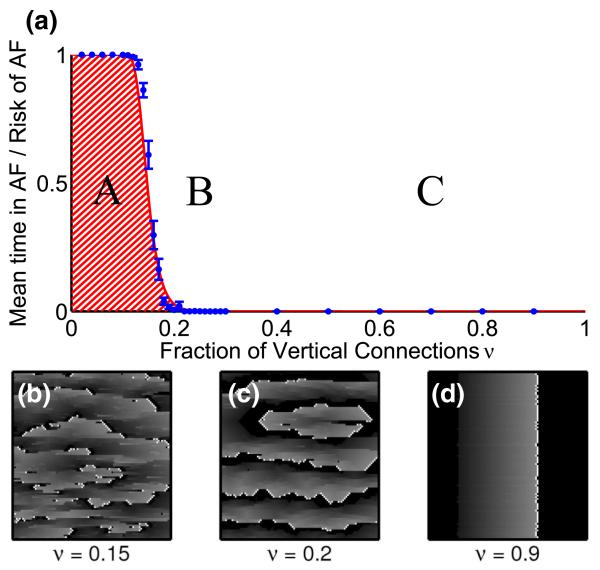
FIG. 3.
(color online). (a) A phase diagram of the model with L = 200, τ = 50, ∊ = 0.05, and δ = 0.05. Pacemaker cells self-activate with a period of T = 220. As ν decreases from 1, a transition from planar wave fronts (C) to a few self-terminating reentrant circuits (B) occurs. As ν is decreased below ν★ ≈ 1 − (δL2)−1/τ ≈ 0.14 the system develops multiple self-sustaining reentrant circuits (A). The red line is the analytically calculated probability Prisk = 1 − [1 − (1 − ν)τ]δL2 of having at least one fibrillation-inducing structure, see Fig. 2(e). The solid blue circles represent the average duration that a system displays nonplanar wave fronts, averaged over 50 realizations of duration 106 time steps and error bars represent one standard error of the mean. (b)–(d) Realizations of systems with ν = 0.9—planar behavior, ν = 0.2—single self-terminating rotor, and ν = 0.15—multiple self-terminating rotors. See Fig. 2 of the Supplemental Material [32] for the full image.

