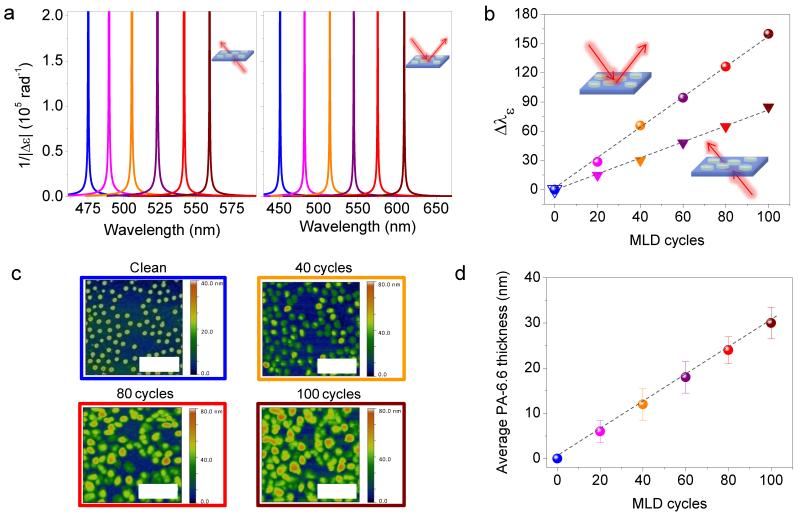
Figure 3. Surface sensitivity assessment combining polarimetry and AFM measurements.
a Plot of the inverse of the transmitted (left panel) and reflected (right panel) light ellipticity 1/|Δε| spectra as a function of molecular layer deposition (MLD) cycles (at steps of 20 cycles). b 1/|Δε| resonance wavelength λε as a function of the MLD cycles for the two measurements geometries. In both cases, a linear dependence of λε vs. number of MLD cycles is observed (the black dashed lines are guide for eyes). The shift of λε saturates for a number of MLD cycles equal to 120, corresponding to a PA-6.6 thickness of ~35 nm, as shown in Supplementary Fig. 7 for transmission geometry case. Such PA-6.6 thickness agrees well with the near-field spatial extension (see Supplementary Fig. 4). c AFM images taken from the same sample region (total area imaged 2.7 × 2.7 μm2) after different numbers of MLD cycles. The AFM images show that PA-6.6 grows only on top of the nanoantennas. The colors of the frames refer to the corresponding colored polarimetry (b) and thickness (d) data points. The length of the white scale bars in the images corresponds to 1 μm. d PA-6.6 average thickness as function of the MLD cycles after AFM topography image analysis. Surface sensitivities (spectral variation of λε divided by the average nylon thickness) of ~3 (transmission) and ~5.3 (reflection) are found combining plots (b) and (d). The error bars indicate the standard deviation from the average thicknesses measured analyzing the AFM images.

