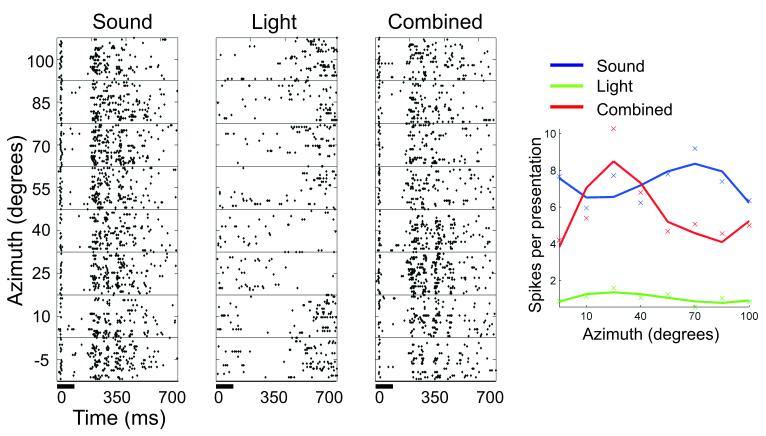
Fig. 1.
Multisensory spatial receptive fields of a ferret auditory cortical neuron. The raster plots in the 3 left panels show the action potential responses of the neuron to 100 ms bursts of broadband noise (far left plot), a white light-emitting diode (center raster plot), or both the sound and light together (right raster plot). In each raster plot, the timing of stimuli are indicated by a horizontal bar at the bottom of the plot, and responses to stimuli are plotted across a range of stimulus locations in the horizontal plane (y-axis). The spike rate functions of the neuron for auditory (blue line), visual (green line), and audiovisual (red line) stimulation are summarized in the plot to the far right. In this example, pairing spatially coincident visual and auditory stimuli resulted in a more sharply tuned spatial response profile that carried significantly more information about stimulus location. Adapted from Bizley and King (2008).

