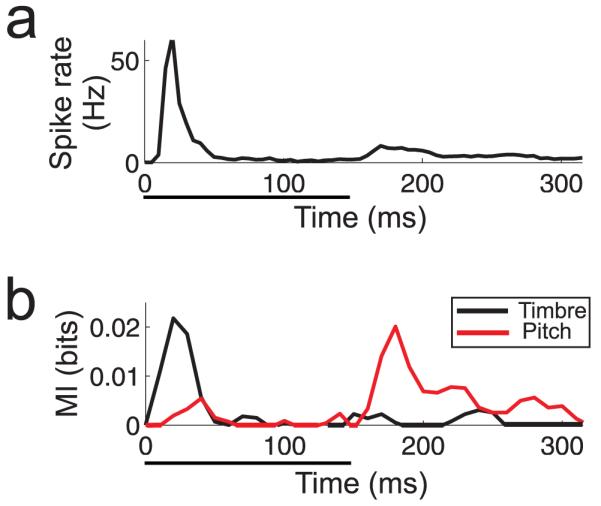
Fig. 4.

Time-division multiplexing within a single auditory cortex neuron described by Walker et al. (2011). a. Post-stimulus time histogram, showing the mean firing rate of the neuron across all presentations of an artificial vowel sound presented over 4 locations in horizontal space, 4 values of the fundamental frequency (“pitch”), and 4 spectral identities (“timbre”). Sound presentation time is indicated by the black horizontal bar below the plot. b. Mutual Information carried by the neuron for either the timbre (black line) or pitch (red line) of the sound throughout its response. Note that these values peak at different time points.
