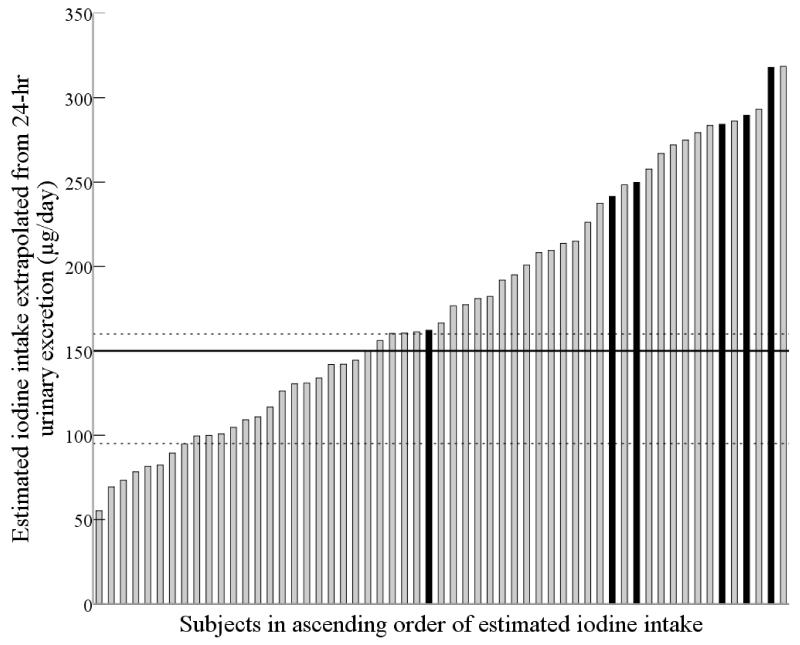
Figure 1.
Subjects in ascending order of iodine intake extrapolated from 24-h urinary iodine excretion. Black bars indicate subjects who took a supplement containing iodine. The middle solid line shows the RDA for adults (150 μg/day)(7). The dashed lines represent the IOM EAR values: the lower dashed line represents the EAR for adults (95 μg/day) and the upper dashed line represents the EAR for pregnant women (160 μg/day)(7).

