
Figure 4.
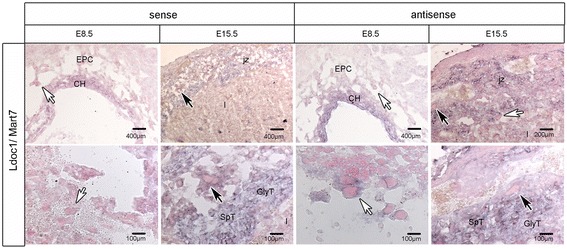
Localization of Ldoc1/Mart7 in the mouse placenta at E8.5 and E15.5 by ISH. Ldoc1/Mart7 sense and antisense transcripts are shown in placental tissues at E8.5 and E15.5. Lower magnifications of tissue sections are shown in upper panels and higher magnifications of specific regions in lower panels. Black arrows identify positive pTGCs from congruent low (top) and high (bottom) magnified regions in both pictures, whereas white arrows identify pTGCs from new tissue regions. Bars are shown in μm. For all abbreviations see Figure 3.