
Figure 6.
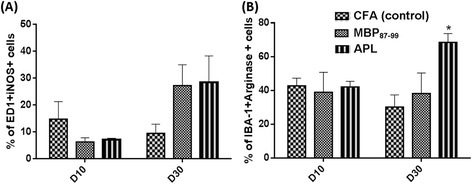
Analysis of M1 and M2-like macrophages in the injured nerve. The percentage of (A) ED1+ and iNOS+ cells (M1 macrophages) and (B) Iba-1+ and Arginase + cells (M2 macrophages) at 10 and 30 days post-CCI in the LSN. *P < 0.05 represents a significant difference between APL-treated and control rats (n = 3 per group; mean ± SEM; two-way ANOVA with Tukey’s multiple comparison test).