
Figure 9.
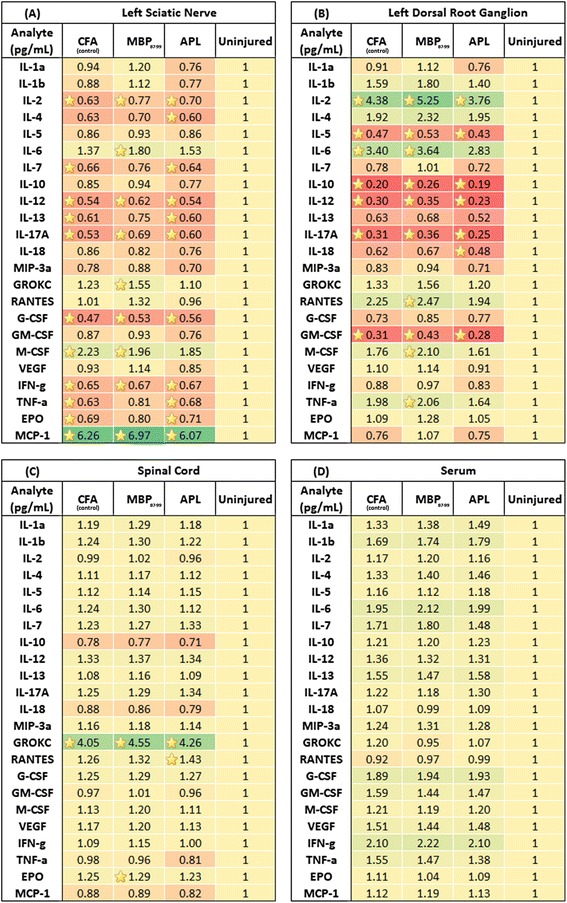
Bio-plex analysis of cytokine expression profile in the nervous tissue and serum at 10 days post-CCI. Heat maps illustrating the summary of fold change expression of cytokines in the (A) LSN, (B) left DRG, (C) spinal cord, and (D) serum of immunized nerve-injured rats compared to control uninjured naïve rats at 10 days post-CCI. Yellow asterisks indicate significant differences in cytokine concentrations in treatment groups as compared to the uninjured control group (n ≥ 4 per group; one-way ANOVA with Dunnet’s multiple comparison test compared to the uninjured group).