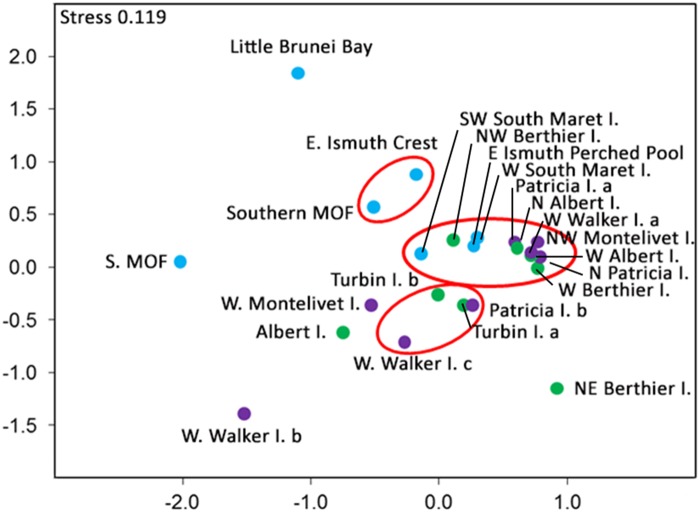
Fig 4. Spatial variation in the composition of the coral assemblages at three island groups in the Bonaparte Archipelago.
Maret Group (blue dots); Berthier Group (green dots) and Montalivet Group (purple dots). Kruskal’s non-metric multidimensional scaling (nm-MDS), using Bray-Curtis similarity index of the coral assemblage at 23 sites based on relative abundance data. Linkages are based on weighted pair group averages and ellipses indicate those sites with 60% similarity at P < 0.001.

