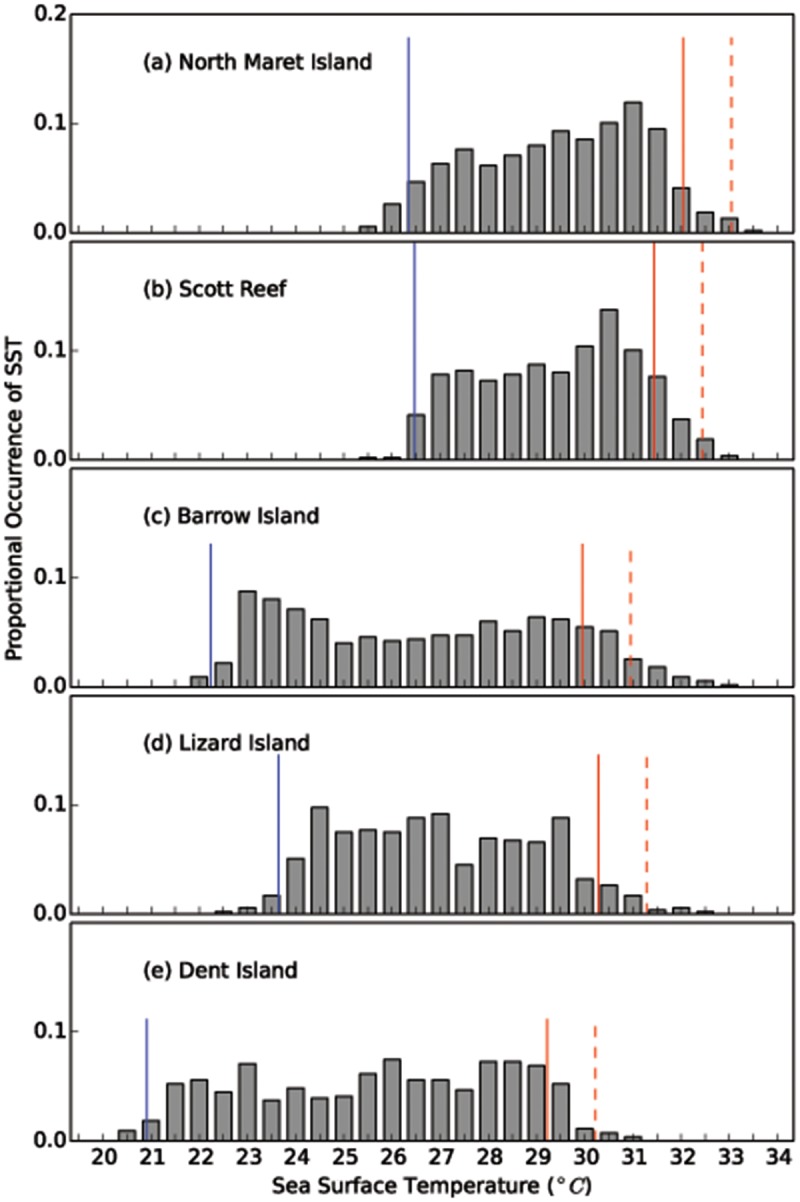
Fig 7. Spatial comparison of sea-surface temperatures from 2002–2014.

Presented is the proportional occurrence of SST (a) North Maret I., (b) Scott Reef (c) Barrow I., (d) Lizard I, and (e) Dent Island. The red line shows the mean max. summer SST; and the red dashed line (- - -) shows the + 1°C bleaching threshold (sensu NOAA); the blue line shows the mean min. winter SST.
