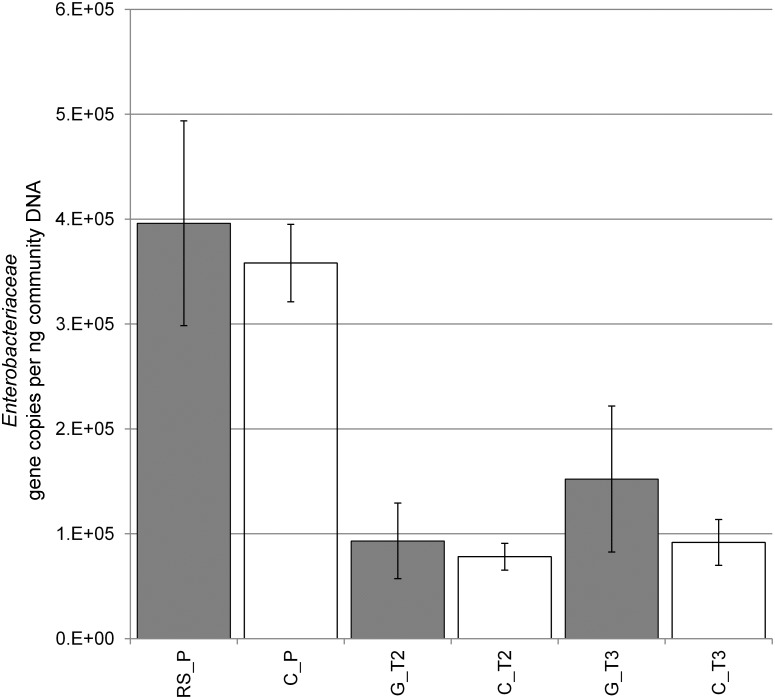
Fig 4. Abundance of Enterobacteriaceae per ng community DNA isolated from 5 g of the respective samples of the foliage.
Error bars represent the confidence interval under p < 0.05. (Confidence error of the mean based on RS_P = n 18, C_P = n 19, G_T2 = n 7, C_T2 = n 7, G_T3 = n 8, C_T3 = n 8). (Treatments; C = Control/untreated, G = Gastropoda, RS = R. solani; time of samplings T2–T3)

