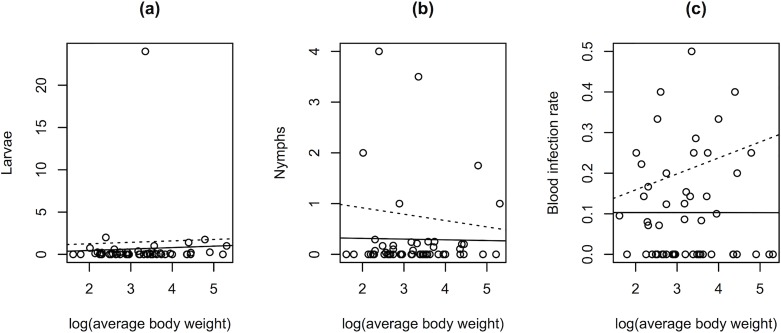
Fig 2. Body weight as a null model for presence or absence of tick infestation and B. burgdorferi s.l. infection in birds.
Graphs depict: (a) larvae per bird by log(average body weight), (b) nymphs per bird by log(average body weight), and (c) bird infection by log(average body weight). Each data point represents one bird species. One outlier point in plot (a) represents Lark Sparrows (Chondestes grammacus). The solid line is a regression on all species, while the dotted-line is a regression on zero-truncated data (species with positive results only).

