
Figure 6.
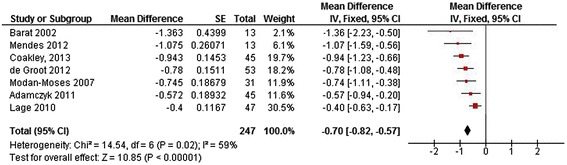
Forest plot of LBMD (Z-score) in patients with Phenylketonuria. (SE = standard error, IV = Inverse Variance, CI = confidence interval).
Official websites use .gov
A
.gov website belongs to an official
government organization in the United States.
Secure .gov websites use HTTPS
A lock (
) or https:// means you've safely
connected to the .gov website. Share sensitive
information only on official, secure websites.
Forest plot of LBMD (Z-score) in patients with Phenylketonuria. (SE = standard error, IV = Inverse Variance, CI = confidence interval).